How We Implemented Agents That Operate Your Live UI
Most AI copilots provide textual responses. At Acceldata, we wanted one that reads a pipeline run and redraws the graph in front of you, an agent that lives on the server, operating a UI that lives in the browser.
If you want to build this capability for your own organization, or if you are a curious engineer looking for cutting-edge inspiration on how to build with AI, here is a detailed description of the processes that allowed us to successfully pioneer this implementation.
Making the Graph Legible
Data pipeline monitoring fails when data corruption occurs without system crashes. For example, a finance dashboard displays a 3x revenue inflation, yet the upstream orchestration engine reports a completely healthy run: all tasks are green, no alerts fired, and execution times are normal.
To debug this, you must inspect the Directed Acyclic Graph (DAG) of the specific pipeline execution. So you open the run graph to see what actually happened:
Run of the pipeline with 265 tasks
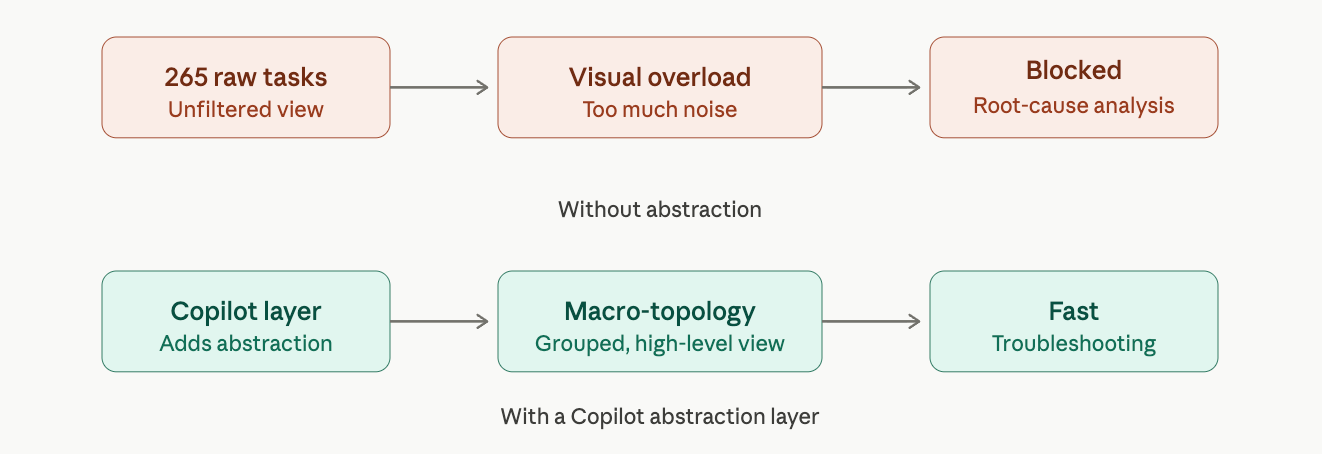
At production scale, a single pipeline run can easily contain 265 individual tasks. When faced with a Directed Acyclic Graph (DAG) of this complexity, human visual inspection fails. It becomes nearly impossible to identify the logical flow of data, trace entry and exit points, isolate critical paths, or pinpoint the specific structural change causing a data corruption issue down the line. Manually scrolling through thousands of execution logs and events is simply not scalable.
To debug effectively, an engineer first needs a macro-level view of the entire pipeline architecture rather than microscopic task details. Providing this structural clarity is the core function of the copilot.
To achieve this, the Acceldata platform unified all distributed execution metadata into a standardized model. The platform ingests runtime details directly from existing enterprise orchestrators and compute engines, including Airflow, Spark, dbt, Azure Data Factory, Fivetran, AutoSys, Trino, and SnapLogic. This data is captured seamlessly via OpenLineage, native SDKs, or dedicated datasource connectors to build a complete, end-to-end map of your data pipeline environment.
To fix a confusing pipeline graph, we asked the copilot a simple question: "Help me understand what this run is doing." Instead of typing out a long paragraph to explain it, the AI directly changed the screen. It took the 265 messy boxes and combined them into about 15 clearly labeled super-nodes that show the main steps of the data flow. Now, the graph is easy to read. You can instantly see six business teams processing data in parallel, a step where that data is combined, the creation of data marts, and the final export to Snowflake.
You can also change how the AI groups these boxes based on your question. If you ask the copilot to show how data moves across different hardware or cloud platforms, it instantly rearranges the same run into a completely different view. For example:
- View A (By Business Stage): Ingest > Aggregation > Data Marts > Snowflake.
- View B (By Cloud Infrastructure): Google Cloud Storage (raw files) > BigQuery (processing layers) > Snowflake (storage layer).
The Copilot Regrouping the 265-task Run Two Ways — First by Pipeline Stage, then by Platform Layer.
Until you can see the overall shape of the pipeline, looking at individual task details does not help. And unlike a static diagram drawn by hand that quickly becomes outdated, this view is created on the fly. The AI reads the live data from the run and regroups the screen to fit your exact question.
The Core Idea: UI as a Tool Surface
The most important part of this pattern is that the copilot does not just describe the graph to you in text. Instead, it actively changes the graph on your screen.
How does this work? We achieved this by splitting the AI's capabilities into two distinct types of tools. We gave the agent two kinds of tools, side by side. (New to agent "tools"? A tool is just a function the model can choose to call, with a described, schema'd signature; a tool-calling loop runs the calls it picks and feeds the results back, so it can decide what to do next.)
Data tools — read-only SQL over pipeline metadata and lineage (PostgreSQL) and span-level execution events (ClickHouse). The agent correlates across both in its reasoning.
UI tools — actions that change what the user sees: regroupGraph, filterGraph, annotateNodes, addNodes, traceColumnLineage, focusNode, and more.
It's worth being concrete about what a UI tool actually is. Each one is a small, fixed building block, a function with a described, schema'd set of inputs that changes one thing on the canvas: group these nodes, filter to those, annotate this one, trace that column. We built them as a deliberate vocabulary. The agent never gets pixel-level control of the screen; it gets this set of moves and composes them to paint the view it needs. That limit is the point, the agent can only do what the UI already knows how to do safely.
So the agent queries the data, reasons about what matters, and then calls UI tools to turn that insight into something on screen. The text answer and the redrawn graph are produced in the same turn, by the same agent.
If this shape sounds familiar, it's the same one now emerging as WebMCP, the proposed browser standard for letting a website expose its features to an AI agent as described, schema'd tools. The difference in our case is that our agent runs server-side, not in the browser, which is exactly what makes the wiring the interesting part. (A parallel effort runs the other way: Google's A2UI and the AG-UI protocol let an agent generate new UI for the client to render, rather than operate one that already exists — same idea, opposite direction.)
The Pattern and Mechanism: Tools that Run in the Browser
The agent (a LangChain tool-calling agent) runs on the server; the UI tools have to run in the user's browser, because that's where the graph is. So when the agent calls regroupGraph, the tool's implementation isn't on the server at all, it's a proxy to the frontend.
Each UI tool has two halves.
The manifest - a name, a description, and a JSON Schema for its arguments: is what the frontend hands to the server so the agent can call the tool.
The handler is where the work actually happens: a function that stays in the browser, takes those arguments, and changes the canvas.
The server only ever sees the manifest; the handler never leaves the client. There's a small registry that spans the app: when a page with copilot tools mounts, it registers them; when the user navigates away and that page is destroyed, they're torn down. So the available tools always track wherever the user actually is. The frontend sends that live set of manifests with every message, so the server builds tools from exactly what's on screen, no stale definitions to drift out of sync:
// CopilotToolRegistryService — declare a UI tool: name, description, JSON Schema
this.copilotRegistry.registerTool(
  {
    name: 'regroupGraph',
    description: 'Collapse nodes into logical super-groups. group_by: '
      + '"tasks" (by pipeline stage) or "assets" (by platform layer)...',
    parametersSchema: { type: 'object', properties: { /* ... */ }, required: [...] },
    execution: 'immediate',
  },
  async (args) => host.handleRegroupGraph(args)   // runs IN the browser
);
On the server, that manifest becomes a normal LangChain tool, but when the agent invokes it, the tool doesn't execute anything locally. It registers a Future, publishes a tool_call_request, and waits for the browser to do the work.
There's a second thing the frontend sends with every message: the page context. It tells the server which pipeline and run you're looking at, what's selected, and which view is open. That's why you never type an ID or spell out which pipeline you mean, the copilot is scoped to whatever page you're on, because the UI already told it.
A related question: How does the agent know which nodes to pass?
Mostly, it doesn't pass node IDs at all. For something like regroupGraph it sends patterns: match rules over the node names it queried (say, everything matching ingest_%), and the frontend, which actually holds the graph, its nodes, and its edges, resolves those patterns against what's on screen. The agent never holds the 265-node graph in its context; the frontend already has it, so the frontend does the matching.
The Difficult Part: The Agent and the Browser aren't on the Same Machine
In production, the agent's reasoning loop and the user's websocket connection may live on different pods. The pod running the agent can't talk to the browser directly. So we route the whole round-trip through Redis pub/sub:
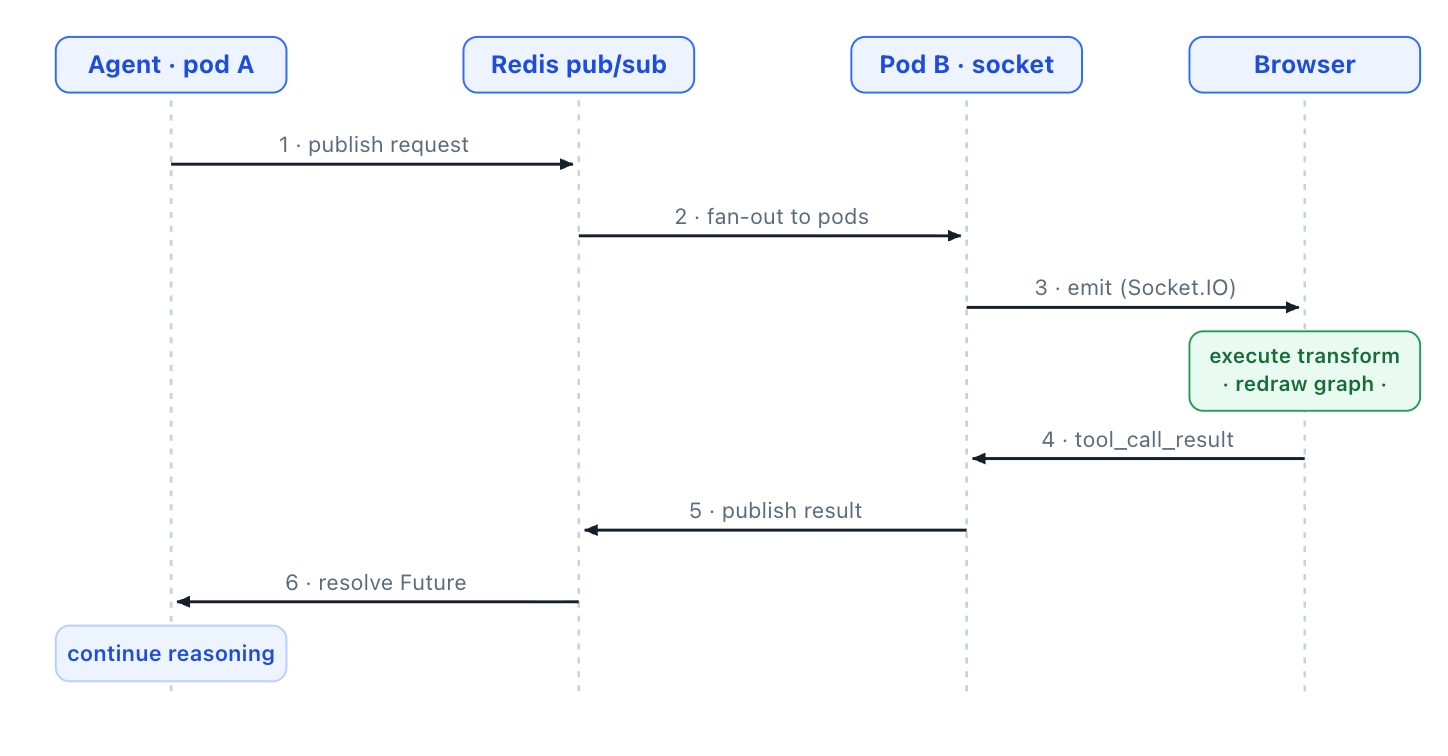
- The agent calls the tool. The server registers a Future keyed by a call_id and publishes a tool_call_request to Redis.
- Every pod receives it; the one pod that owns the user's socket emits it over Socket.IO to the right browser tab.
- The browser executes the real graph transform, redraws the canvas, and emits a tool_call_result.
- That result goes back through Redis. The origin pod, the one holding the Future, resolves it; every other pod no-ops.
- The agent wakes up with the result and keeps reasoning. Timeouts and cancellation make sure it never hangs indefinitely if the user closes the tab.
async def _arun(self, **kwargs):
    future = loop.create_future()
    call_id = str(uuid4())
    # Register BEFORE publishing so a racing result can always find the entry.
    self.socket_manager.pending_tool_calls[call_id] = PendingToolCall(future=future, ...)

    await self.socket_manager.redis_pub_sub_service.send_response(
        self.conversation_id,
        json.dumps({"type": "tool_call_request", "call_id": call_id,
                    "tool_name": self.name, "args": kwargs, ...}),
    )
    try:
        result = await asyncio.wait_for(future, timeout=self.tool_timeout)  # 60s
        return json.dumps(result)
    except asyncio.TimeoutError:
        # User navigated away / frontend stuck — never block the agent.
        return json.dumps({"success": False, "error": "UI tool did not respond..."})
    finally:
        self.socket_manager.pending_tool_calls.pop(call_id, None)
Two details keep the round-trip orderly. Each call carries its own call_id and every event is filtered by conversation, so a reply never lands on the wrong call or the wrong tab. And the whole exchange rides the app's existing authenticated socket: every data tool the agent calls goes through the same tenant-scoped APIs as a normal user request, so the agent can only ever see and act on what the signed-in user could.
It's worth being clear about the edges. The transport rides best-effort pub/sub, so a dropped event surfaces as a timeout, the agent is told the tool didn't respond and moves on, rather than crashing. The canvas is a surface the human shares with the agent, so the agent re-reads state instead of trusting a stale snapshot. Durable queues, idempotent re-delivery, and version tokens are the obvious next layer; for an in-product copilot, where a missed redraw means the user just re-asks, not a lost transaction, we started with the simpler round-trip on purpose.
The Harness: What Makes it Reliable
A demo where the agent draws one pretty graph is easy. A system where it does the right thing on a real, messy pipeline, and degrades predictably when it doesn't, is the harder problem. The part of the system that handles that is what's increasingly called the harness: the runtime around the model that validates, executes, and logs everything the model proposes. The model proposes actions; the harness decides what the agent is allowed to do, and what it's told came back. Most of our effort went here, not into the LLM call itself. Three things it does:
1. Validate before you mutate
Every UI tool fully validates its arguments before touching the rendered graph. Do these node IDs exist in the current view? Do these edges connect real nodes, or dangle? Would this produce an empty or misleading picture? (regroupGraph, for instance, refuses to render if the groups match nothing.) A bad call is rejected before anything is drawn, so a malformed grouping doesn't render as a broken one; the rejection comes back to the agent as a reason, not a silent no-op.
2. Close the loop with structured results
Tools don't just succeed or fail silently. They return structured diagnostics, which node IDs didn't resolve, which edges were dropped, whether an active view had to be suspended, and those flow straight back into the agent's context. So when the model passes a node ID that doesn't exist, it gets told exactly that, and corrects itself on the next turn instead of confidently narrating a graph that isn't on screen. The model proposes; the harness disposes, and reports back.
3. Constrain the model in the prompt
Hard rules, enforced in the system prompt: every entity you mention must come from a tool call in this turn (no narrating remembered, stale data); never present a partial result as exhaustive; check what's already on the canvas before adding to it.
4. Know the canvas before you change it
By the second or third question, the agent has usually already redrawn the graph. Before its next change it calls getGraphState to see what's there now, then decides whether to extend the current view, replace it, or start from a blank canvas, so a follow-up builds on what's on screen instead of wiping it out.
Reliability isn't one clever trick, it's a stack of small guardrails like these. None of this is model-specific, it's scaffolding around whatever LLM sits underneath, which is where we chose to spend our effort.
From View to Investigation
Reading the graph was just the start. Once the agent can change the graph, the same loop runs a real investigation, and here we go back to those wrong revenue numbers. It took a few more questions, each one a round of query → reason → redraw:
- Scan this run for volume anomalies: The agent compares the run against previous ones, flags a single task,
stage_stg_sales_invoices, writing 3× its usual rows, and badges it on the graph withannotateNodes. - What changed in that task?: It diffs the SQL that task ran against the previous run (the platform already captures it, keyed per task, so this is a lookup, not guesswork), finds a removed
QUALIFY ROW_NUMBER()dedup clause, a code regression, not bad data, and flags the culprit, again withannotateNodes. - What's downstream?: It uses
addNodesto pull in the downstream and cross-pipeline assets, 42 of them across three platforms and two other pipelines, landing on the very Power BI dashboard the finance team complained about, thenannotateNodesto mark what's affected, down to the inflated columns.
And none of it works without the data underneath. Whatever ran the pipeline: Airflow, Spark, dbt, and the rest, the platform records each task's span events in a normalized shape: operational metrics like rows-written and bytes-processed, and the actual SQL each task ran, all land under the same keys. So when the agent compares this run to the last one, it isn't parsing five different log formats, it's comparing the same fields across two runs. That normalization is what turns "scan for volume anomalies" and "diff the SQL" into simple lookups instead of research projects.
The Investigation After the Two Regroups
It went from a wrong number on a dashboard to one deleted line of SQL, all in the graph, just by asking. This was the clean path, of course: a vaguer question can still send the agent down the wrong grouping and take a follow-up to set right. But the first step is never optional, you can't investigate a pipeline you can't read.
Scope Beyond Pipeline Observability
We built this for pipeline observability, but the pattern, an agent that operates a live, stateful, visual UI through described tools, generalizes anywhere the answer is better shown than told and the user is already working in the interface. It doesn't even have to be a graph.
The test is simple. Is your interface complex, stateful, and visual? Is the user already in it? Would they rather see the answer than read it? If yes, your UI should be a tool surface for an agent.
Key Takeaways
- Treat your UI as a tool surface: Expose actions as described, schema'd tools, not as fragile post-hoc parsing of model text.
- Wrap it in a harness: The model reasons; the harness validates, executes, and reports. Budget most of your effort here, not on prompt wording.
- Validate before you mutate: Never let a bad tool call reach rendered state. Reject cleanly; keep the screen coherent.
- Close the loop: Feed structured tool results back so the model self-corrects instead of hallucinating success.
- Let the side that holds the state resolve it: The agent sends patterns; the frontend, which has the graph, does the resolving. The model stays light.
- Plan for multi-pod early (if you'll run more than one): A server-side agent plus a browser UI makes the round-trip distributed, we used Redis pub/sub plus a pending-call registry. Don't bolt it on after the first cross-pod bug.
The pipeline copilot is one capability in ADM(Agentic Data Management). To know more about the platform, see Why We Built ADM and ADM: Architecture, Agents, and Orchestration.
And, if you don't want to miss what's happening in the Engineering world, subscribe to get new blogs every week.