How to Diagnose and Fix Performance Bottlenecks in a High Throughput Scala Microservice
A Practical Breakdown of How We Diagnosed the Performance Bottleneck Across Event Transport, Application Code, and the JVM
A few months ago we got pulled into a problem that looked, on the surface, like a routine capacity issue. A service we own had started falling behind. CPU was pegged, throughput was sagging, and the usual response of "give it more resources" was already on the table before anyone had actually looked at what the service was doing. I want to walk through how we actually diagnosed it, because the path we took is one I now use as a template whenever a system starts behaving badly under load, and I think it is worth handing to any engineer who ends up in a similar spot.
Scala Service Overview
The service in question is a Scala microservice that processes Impala query profile events. It is a fairly low-profile piece of infrastructure, which is exactly why nobody had looked closely at it in a while.
Before the fixes, here's how work moves through the service. It runs on an Apache Pekko actor system with cluster sharding, split into two roles:
- Ingest actors fetch and parse payloads, on their own dedicated thread pool so they never block computation.
- Processor actors do the heavy lifting: decoding, extracting metrics, and emitting results.
That split mattered a great deal once we started diagnosing the slowdown. Consumer lag and processing are different failure modes, and watching only one risks scaling the wrong thing, adding ingest capacity for a problem that is not ingest, or missing a mailbox filling up behind a perfectly healthy ingest path.
As our customers' clusters got bigger and their queries got more complex, two numbers crept up at the same time. Individual profile payloads grew to somewhere between 40 and 60 MB each. And the number of profiles arriving per second climbed to more than hundreds. Neither of those numbers alone would have been alarming. Together, they exposed a design that had never been tested at this shape of load.
Event Transport Redesign
My first instinct was not to touch application code at all. Sending 40 to 60 MB payloads directly through our event stream meant every consumer downstream of that stream had to deal with oversized messages, regardless of whether they cared about the payload contents. That is a transport problem, not a processing problem, and it needed to be solved before anything else made sense to investigate.
We moved the large payload data out of the message stream entirely and into NATS Object Store. The stream itself now only carries a small notification telling the microservice where to go fetch the actual profile. This separated the concern of moving data from the concern of announcing that data exists, which is a pattern I would recommend to anyone dealing with oversized events on a shared stream, regardless of what messaging system you are running.
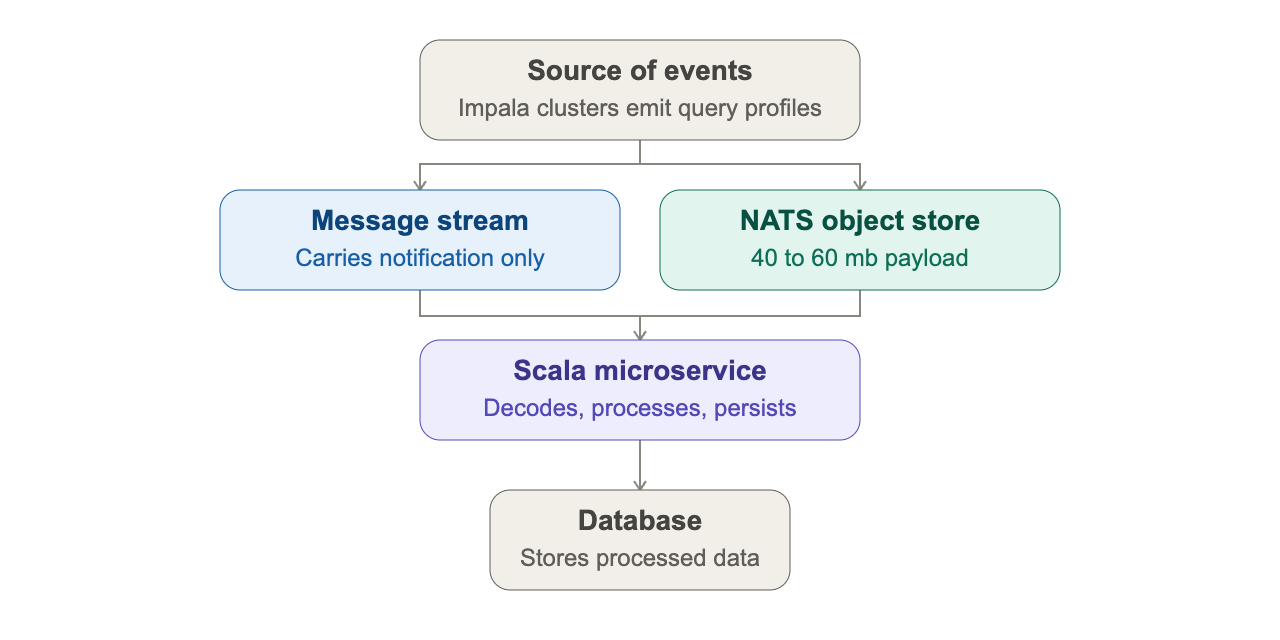
This fixed the symptom that was easiest to see and easiest to explain in a design review. What it did not fix was the amount of work the microservice itself was doing once it actually had the payload in hand. That distinction turned out to matter a lot, because it meant the real question was still unanswered.
Investigation Approach
At this point there were several plausible stories floating around. Maybe the JVM heap was too small. Maybe garbage collection was thrashing. Maybe the database connections were the bottleneck. Maybe it really was just a matter of needing more CPU cores. Every one of these theories had someone in the room who believed it, and none of them had evidence behind them yet.
So instead of picking one and acting on it, we set up a representative workload that could mirror production: payloads in the 40 to 60 MB range, arriving at close to 600 events per second, and we ran the service under that load while we watched it. The approach we followed was deliberately boring and linear:

Every step in that sequence exists to rule something out before you spend effort fixing it. That discipline is what kept us from spending a week tuning garbage collection settings for a problem that turned out to have nothing to do with garbage collection. The first tool we reached for was one of the oldest in the JVM toolbox.
Thread Dump Analysis
Thread dumps are cheap to collect and they tell you a lot before you commit to heavier profiling. We took several, a few seconds apart, using both of these depending on what was available on the box:
jstack <PID> > thread-dump.txt
jcmd <PID> Thread.print > thread-dump.txt
Taking multiple dumps in quick succession mattered more than taking a single one. A single dump just shows you a snapshot. Several dumps close together let you see which threads keep showing up doing the same thing, which is a much stronger signal than any one frame in isolation.
What we saw was threads repeatedly parked in the same internal processing paths, not blocked on network calls or waiting on the database. That ruled out an entire category of explanation. It told us the time was being spent doing computation inside our own code, which meant the next question was not "what are we waiting on" but "what are we actually doing."
Heap and Memory Analysis
Before chasing CPU, we looked at heap behavior and object allocation, because large payloads are exactly the kind of thing that can quietly turn into a memory problem. We wanted to know whether objects were being retained longer than they should, whether particular structures were consuming more memory than expected, and whether the JVM was spending excessive time on collection as a result.
Memory usage stayed within acceptable bounds. That result was almost as useful as finding a problem would have been, because it meant we could stop worrying about retention and object lifetime as the primary driver, and focus the rest of the investigation on where CPU cycles were actually going. With two of the usual suspects cleared, only one serious candidate was left standing.
CPU Profiling with Async-profiler
We profiled the running JVM under the representative workload using async-profiler:
./profiler.sh -e cpu -d 120 -f cpu-profile.html <PID>
The resulting flame graph is the moment this investigation actually turned a corner. There was no expensive query buried in there, no obvious network stall, no elaborate algorithm doing something exotic. What stood out was a plain, ordinary looking method, consuming a disproportionate share of CPU time relative to how unremarkable it looked in the source.
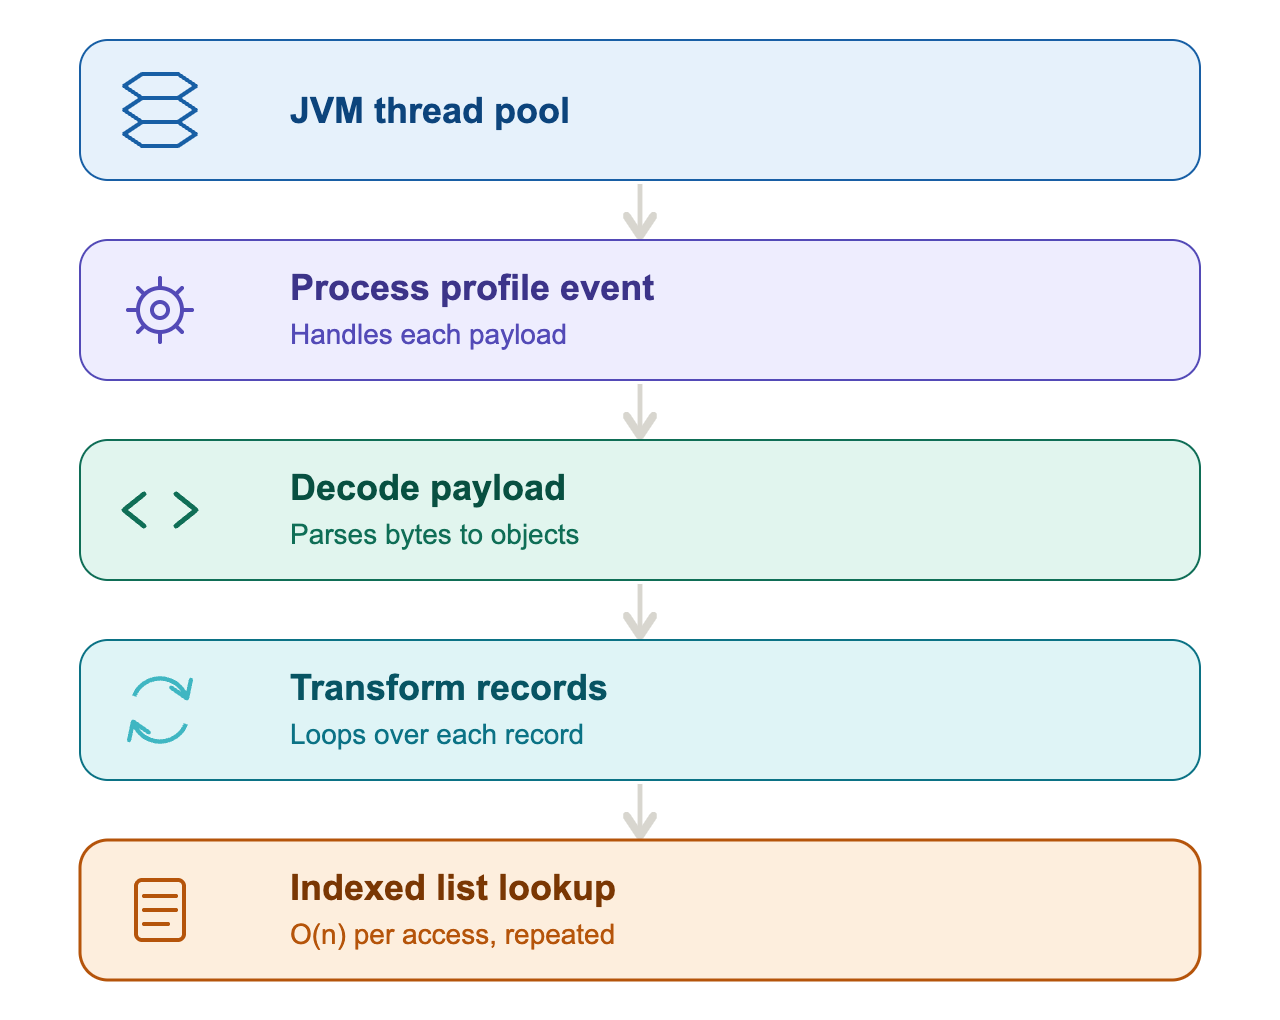
We traced that frame back into the implementation. It led to a data access pattern that, on its own, looked completely reasonable in code review. That is often how these things go: the line of code that costs you the most is rarely the one that looks suspicious when you are reading it casually.
Root Cause: Data Structure Mismatch
The hot path was using a Scala List and accessing elements by index, repeatedly, inside a loop over a large collection of records. A List in Scala is a linked structure. Getting to element zero is instant. Getting to element five hundred means walking through the four hundred and ninety nine elements before it, every single time you ask for it.
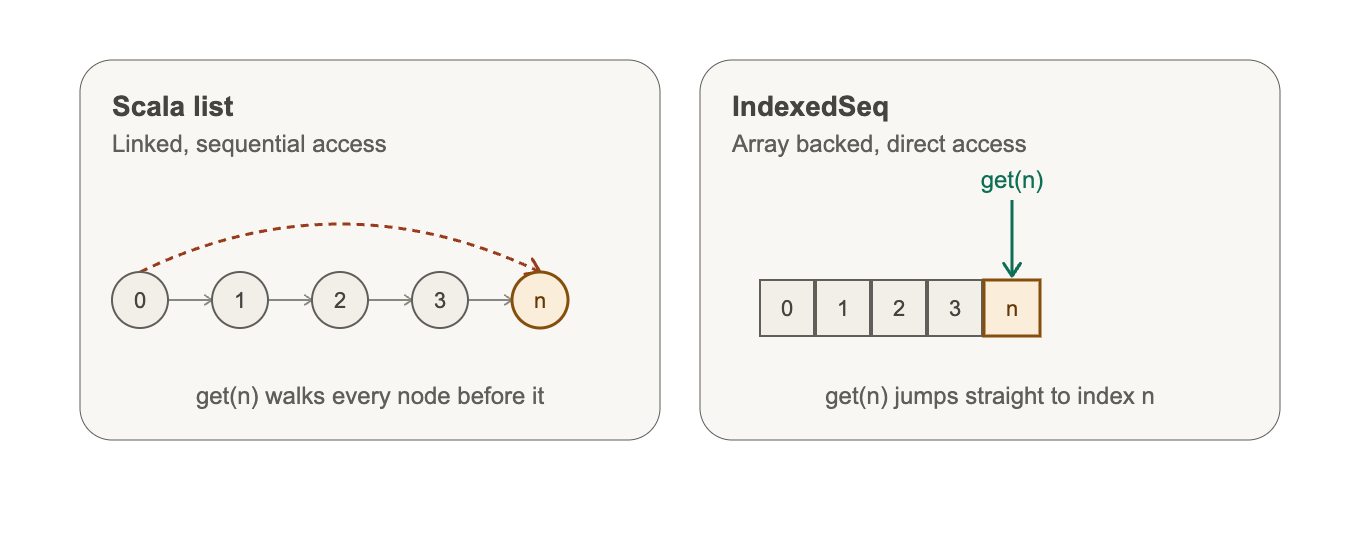
For a handful of records this cost is invisible. Nobody notices a linked traversal of ten elements. But once payloads started carrying thousands of records, and the code kept asking for elements by position over and over, that per lookup traversal cost stopped being negligible and started compounding. With enough repeated indexed access over a large enough collection, the overall cost trends toward quadratic behavior for that access pattern, even though nothing about the surrounding code changed.
I want to be clear about what the actual lesson is here, because it is easy to walk away with the wrong one. List is not a bad data structure. It is an excellent choice for sequential traversal and recursive processing, which is exactly what it was designed for. The problem was never the type itself. The problem was that the access pattern in this particular hot path did not match the structure holding the data, and that mismatch only became expensive once the workload grew past the point where anyone had originally tested it.
The Fix: List to IndexedSeq
Once we had traced the cost to this specific access pattern, the fix itself was almost anticlimactic. On the hot path we switched the relevant collection to an IndexedSeq (in practice, Scala’s immutable Vector), which gives effectively constant-time indexed access instead of a linear O(N) walk from the head on every lookup.
The important part of this change was not swapping one type name for another. It was removing repeated traversal from a path that ran on every single record of every single payload, hundreds of times a second. A change that small only mattered because we had evidence, from thread dumps through to a flame graph, that this exact path was where the cost lived. Fixing the CPU side of things still left one more layer to account for, since large payloads bring their own kind of pressure that has nothing to do with algorithmic complexity.
JVM and GC Tuning
Processing payloads of this size means the JVM is creating a lot of temporary objects and buffers during decoding and transformation, and at hundreds of events per second that allocation rate adds real pressure to garbage collection. Large payloads do not automatically mean long GC pauses, that depends heavily on object lifetimes, allocation patterns, and heap configuration, but at this scale GC behavior earns a place in the analysis rather than being an afterthought.
We tuned the JVM through JAVA_OPTS to give it runtime and garbage collection behavior appropriate for this larger payload profile, and watched GC and memory utilization closely through validation to confirm the extra allocation pressure was not translating into instability or sustained slowdowns. This gave us two improvements working together rather than one masking the other: less unnecessary CPU work inside the application, and a JVM configured to absorb the allocation pattern that large payloads naturally produce.
Validation at Scale
None of this mattered until we went back and tested it the way the problem had originally shown up: 40 to 60 MB payloads, roughly 600 events per second, measured end to end from payload retrieval all the way through persistence. Testing the isolated code change in a microbenchmark would have told us the new lookup was faster in principle. It would not have told us whether the whole system could actually sustain the workload that broke it in the first place.
The validation run showed the system holding steady at target load, with meaningfully lower CPU consumption and GC behavior that stayed within acceptable bounds throughout. That gap between "this operation is faster" and "this system now handles the workload it was failing on" is the entire reason the validation step exists, and skipping it is the easiest way to convince yourself a fix worked when it only worked in isolation.
Summary of Changes
| Layer | Change |
|---|---|
| Event transport | Large profile payloads moved out of the message stream and into NATS Object Store |
| Application | Indexed access on List replaced with IndexedSeq on the hot path |
| Concurrency | Ingest and processing remain separate sharded actor roles; blocking I/O isolated on a dedicated dispatcher |
| JVM | Runtime and garbage collection behavior tuned through JAVA_OPTS |
| Validation | Re tested against the full production shaped workload, not an isolated benchmark |
None of those on their own would have been enough. The transport change alone left the CPU problem untouched. The data structure fix alone would have still choked on oversized messages hitting the stream. The JVM tuning alone would have papered over allocation pressure without addressing the actual hot path. It took looking across the whole stack, and having evidence at each layer, to land on a fix that held up under the real workload.
Where AI Genuinely Helped, and Where It Could Not
I want to be honest about this part because it comes up in every retro now. An AI assistant, pointed at the relevant snippet, could very quickly flag that repeated indexed access on a linked list is worth investigating. That is a legitimate and useful capability, and it would have saved us time if we had used it earlier in the process to narrow our reading of the hot path.
What it could not do is tell us whether that pattern was actually responsible for the production degradation we were seeing, at the scale we were seeing it.
“A code snippet can contain a theoretically inefficient operation without that operation ever mattering in practice, and conversely something that looks trivial can become the dominant cost once it runs millions of times under real load. Only reproducing the workload, profiling it, tracing the hot path, and validating the fix against that same workload could answer that question. AI accelerates the search for a hypothesis. Evidence is still what tells you whether the hypothesis is true, and that gap is exactly where an engineer's judgment still has to do the work.”
Here is Our Replication Checklist
If you are staring at a service that used to be fine and now is not, here is the sequence I would follow again, and the one I would recommend to any team hitting something similar, regardless of whether your stack looks like ours:
- Reproduce the problem with a workload that actually matches production shape, not a scaled down approximation.
- Take thread dumps a few seconds apart before reaching for anything heavier, and use them to separate "waiting on something external" from "doing internal computation."
- Check heap and allocation behavior to rule memory pressure in or out before you assume it is the cause.
- Profile CPU under that same representative load and let the flame graph point you to the actual hot path, rather than guessing which function looks suspicious.
- Once you find the hot path, ask whether the data structure in use actually matches how it is being accessed, not just whether the structure is generally considered efficient.
- Make the smallest change that removes the mismatch, and separately account for infrastructure level pressure such as GC or transport if the payload size demands it.
- Validate against the original workload end to end. A faster function in isolation is not the same claim as a system that now sustains its target load.
This was never really a story about List versus IndexedSeq. It was a story about what happens when a design that worked fine at one scale meets customer workloads it was never tested against, and about how much a small, well evidenced change can do once you actually know where to point it. Every part of that process is reusable on a completely different service with a completely different bottleneck, which is exactly why I wrote it down.
This is one of several deep dives we've written on what we're learning while building and scaling our data infrastructure. Want more stories like this one? You'll find the rest at engineering.acceldata.io.