Building a Scalable Kubernetes Logging Platform
When our Kubernetes footprint was small, logging was the easy part. A single agent picked up container output and pushed it into a search engine, and that was enough. As the number of clusters, teams, and workloads grew, that simplicity stopped being enough. Log spikes from one noisy service began to affect everyone else. Teams wanted assurance that their data stayed separate from other teams' data. Ingestion needed to grow at its own pace, independent of storage. And whenever the search backend had a rough day, we needed the rest of the pipeline to keep functioning rather than fall over with it.
Those pressures pushed Acceldata Devops Team toward a different design, one built around Vector, Kafka, and OpenSearch, with clean boundaries between collecting, buffering, transforming, and storing data. At a glance it looks like this:
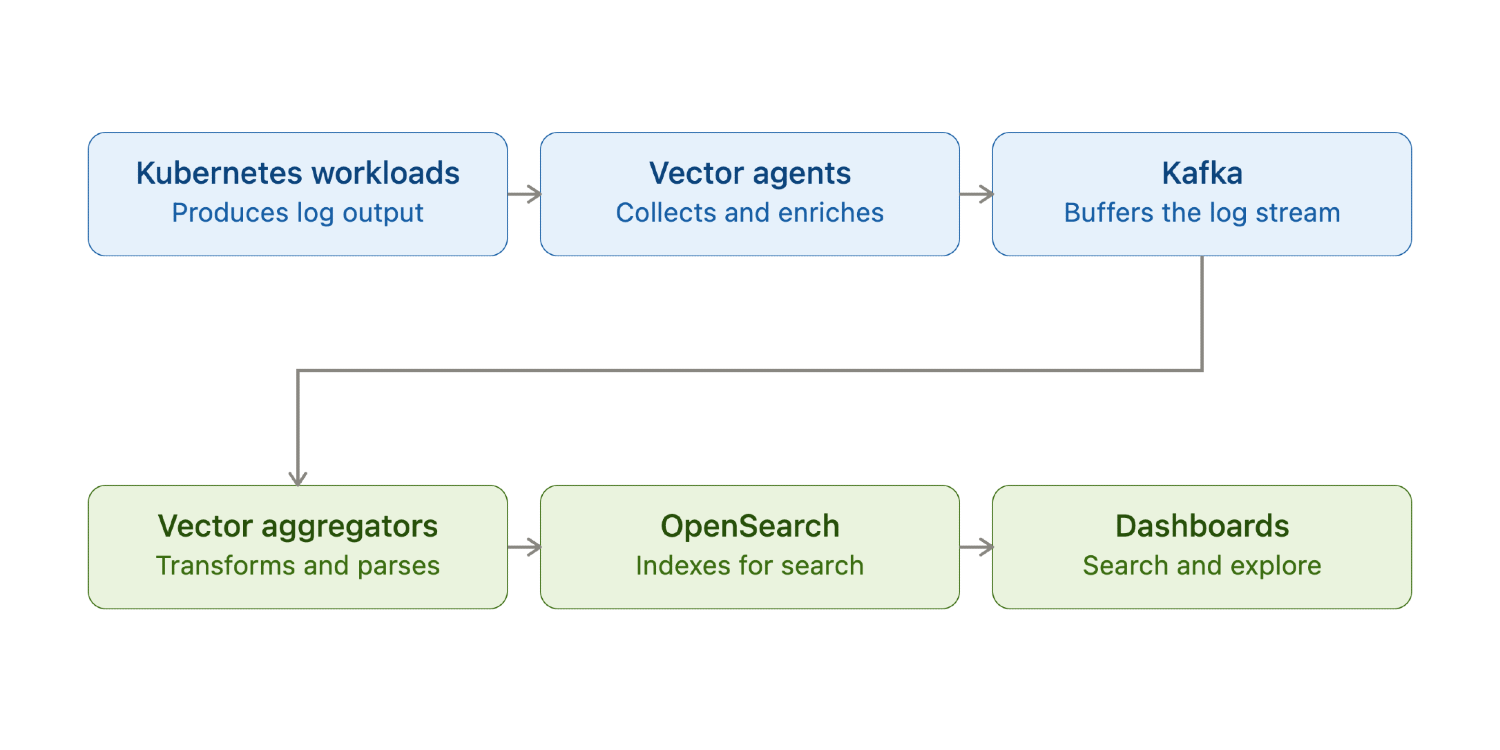
What made this design work was never any single piece of technology. It was the discipline of keeping each responsibility in its own layer, so that a problem in one place did not automatically become a problem everywhere. Walking through those layers one at a time shows why that separation matters so much.
Let’s take a look at the broader picture here:
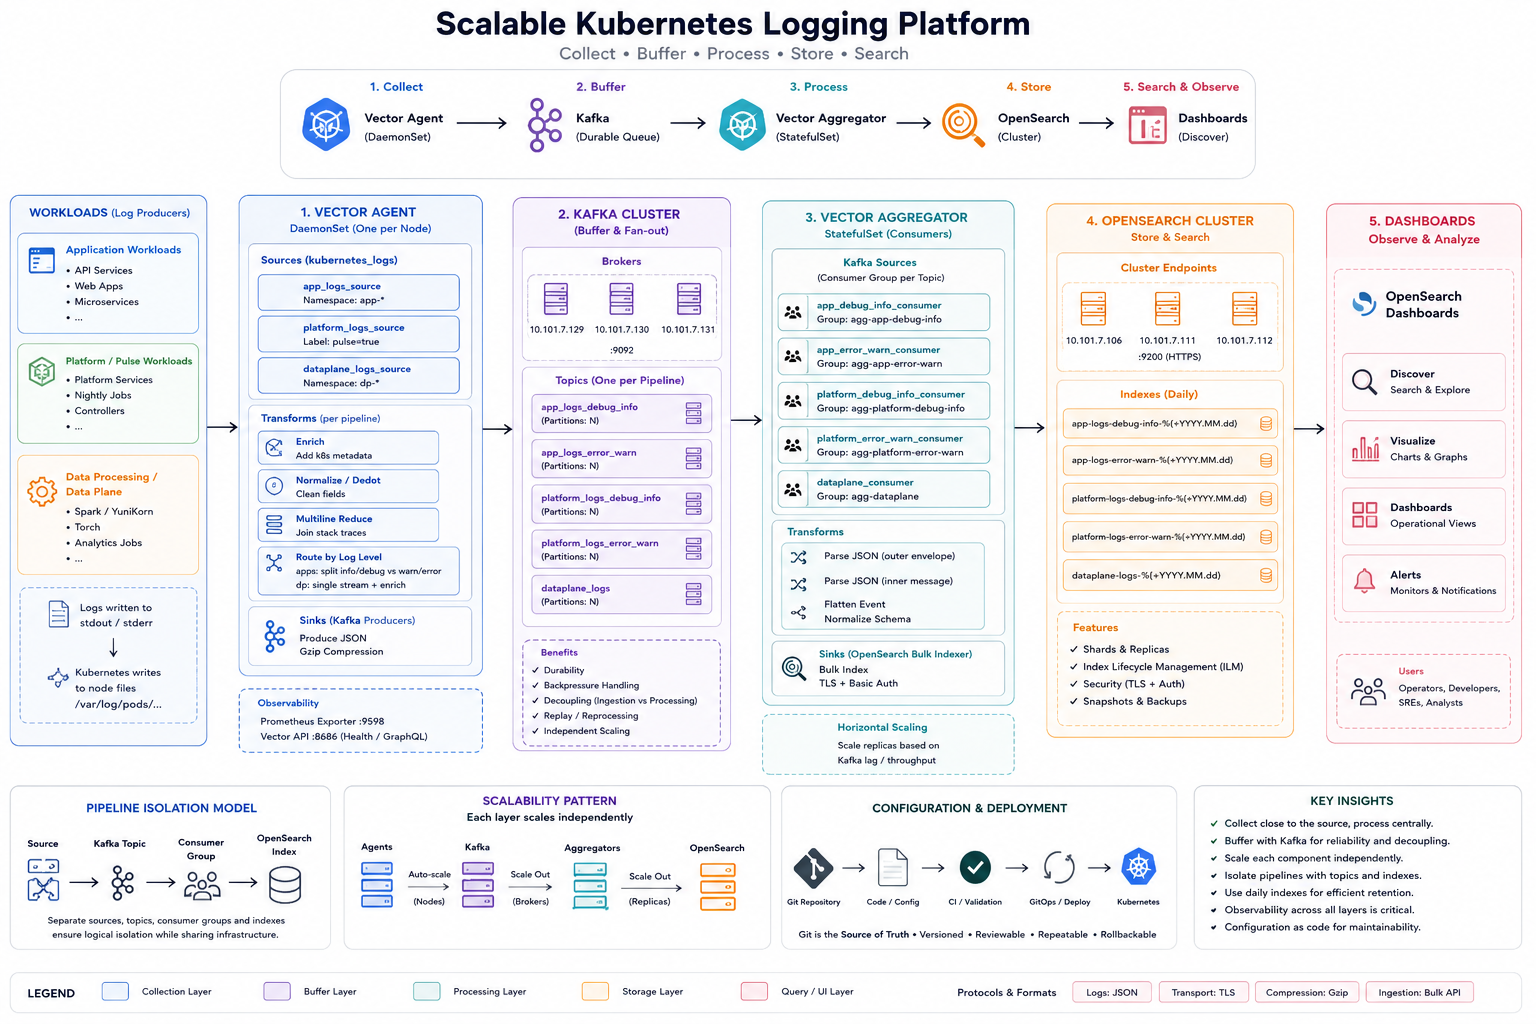
The Producer Layer
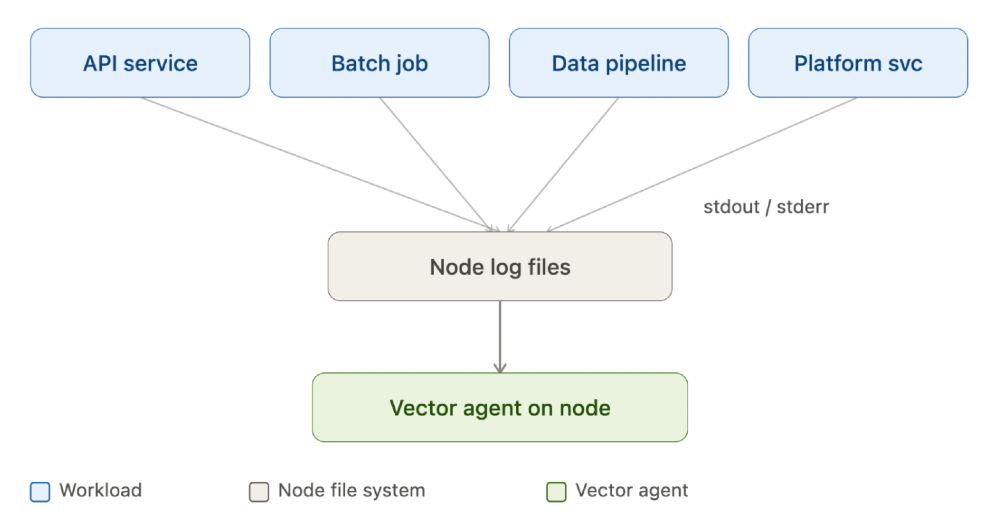
Every pod on the cluster produces logs simply by writing to stdout and stderr, and Kubernetes takes care of persisting those streams to node level files under a path like /var/log/pods/.... Nobody has to modify an application to make it participate in the logging platform, and that is intentional. We wanted logging to be invisible to the people writing application code. A developer should never need to think about how their logs get collected, transformed, or stored. They write logs the normal way, and the platform assumes responsibility for everything that happens afterward.
That principle is what let us support wildly different kinds of workloads on the same platform, APIs, batch jobs, data pipelines, and internal platform services, without asking any of their owners to adapt to our tooling. Once logs leave the container, the next actor in the chain is the agent running on that same node.
Node Level Collection
We run Vector as a DaemonSet, meaning one agent lives on every node in the cluster. Its job is to grab logs locally and do a bit of lightweight shaping before anything leaves the machine: enriching events with metadata, normalizing fields, cleaning up dotted key names, aligning timestamps, stitching multiline events like Java stack traces back into a single record, and routing certain log levels differently. Once that shaping is done, the agent publishes the event onward to Kafka.
We were deliberate about how much work happens at this layer. Because an agent runs on every single node, anything expensive gets multiplied across the whole fleet. A transformation that costs a fraction of a millisecond on one node can become a real drain on cluster resources once it is running hundreds of times over. So the rule we settled on was simple: keep the edge fast, and push anything heavier downstream. That single decision is what makes the next layer, Kafka, so important to the overall design.
Kafka as the Shock Absorber
Early on, it would have been easy to connect Vector straight to OpenSearch and call it done. But that pairing creates tight coupling between collection and storage. If OpenSearch slows down or goes offline even briefly, that pressure travels backward through the pipeline immediately, and a spike in application logging can turn into an outage for the logging system itself.
Introducing Kafka breaks that dependency. Producers write into Kafka, and consumers read from it whenever they are ready, at whatever pace they can sustain. If a service suddenly logs ten times its normal volume, Kafka absorbs that burst instead of passing it straight through to storage.
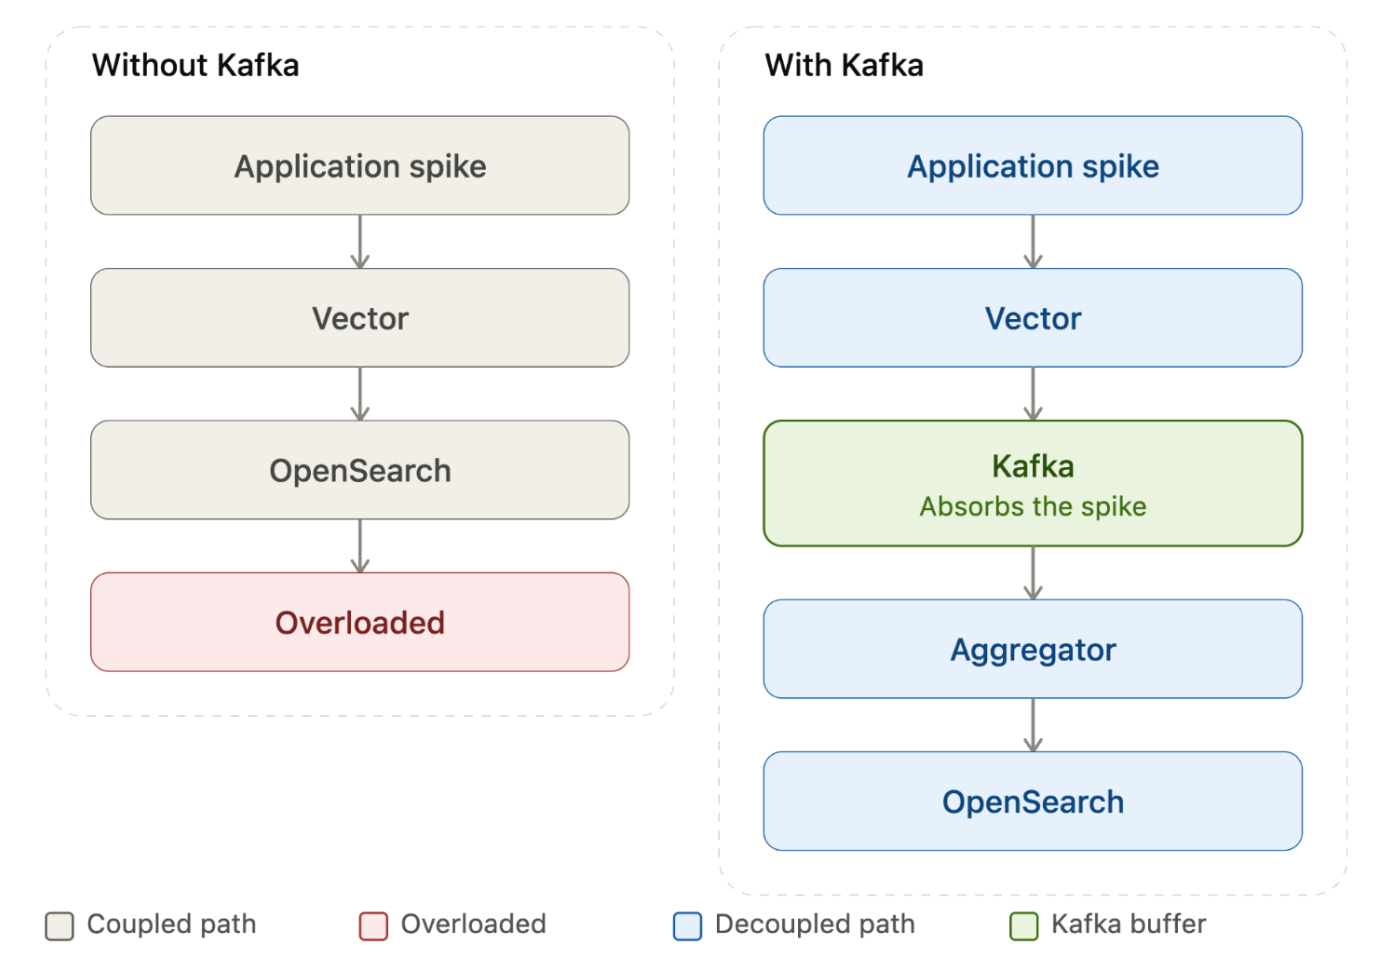
The benefit is not just about surviving traffic spikes. Kafka also gives us failure isolation, the ability to scale ingestion and consumption independently, and room to operate the pipeline without constant firefighting. It effectively becomes a durable holding area between two systems that would otherwise be forced to move at the same speed, which set us up to solve the next problem we ran into: sharing that buffer across many different logging pipelines without letting their data mix together.
Keeping Pipelines Apart Without Duplicating Infrastructure
As more teams onboarded, we needed application logs, platform logs, data processing logs, and batch workload logs to stay logically separate, even though they all pass through the same Kafka cluster. Rather than building a dedicated stack for every use case, we split Kafka into separate topics per pipeline.
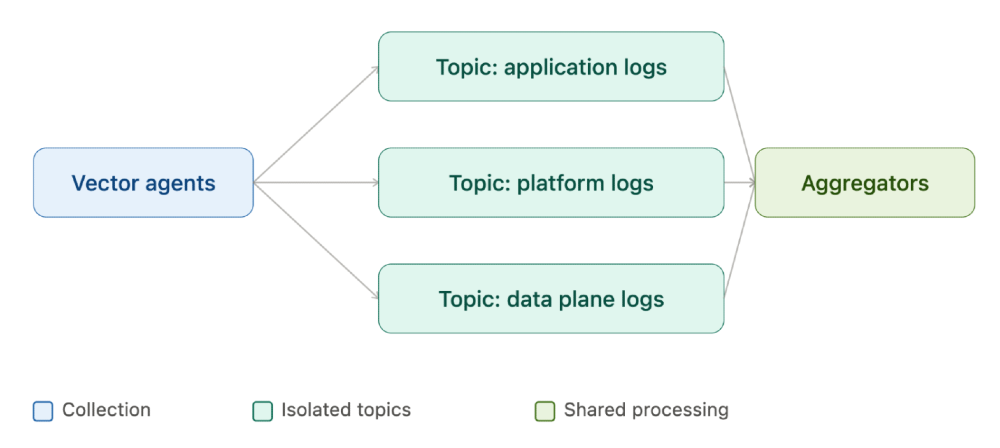
This gave us the isolation teams wanted without the overhead of standing up a separate logging stack for every workload. The underlying principle we kept coming back to was to share infrastructure but isolate data paths, which turned out to be a good balance between efficiency and operational sanity. With topics in place, the next question was what happens to those messages once they reach the other side of Kafka.
The Aggregator Layer: Centralized Processing at Scale
The second Vector layer, which we call the aggregator, is not tied to any particular node. It reads from Kafka and does the heavier lifting: parsing nested JSON, flattening deeply structured events, applying schema normalization, and bulk indexing the results into OpenSearch.
This is where the collection and processing concerns finally separate cleanly. Agents scale with the size of the Kubernetes cluster, because there is one per node by definition. Aggregators scale with log volume, because they are just workloads consuming from a queue, and we can run as many or as few as the backlog demands.
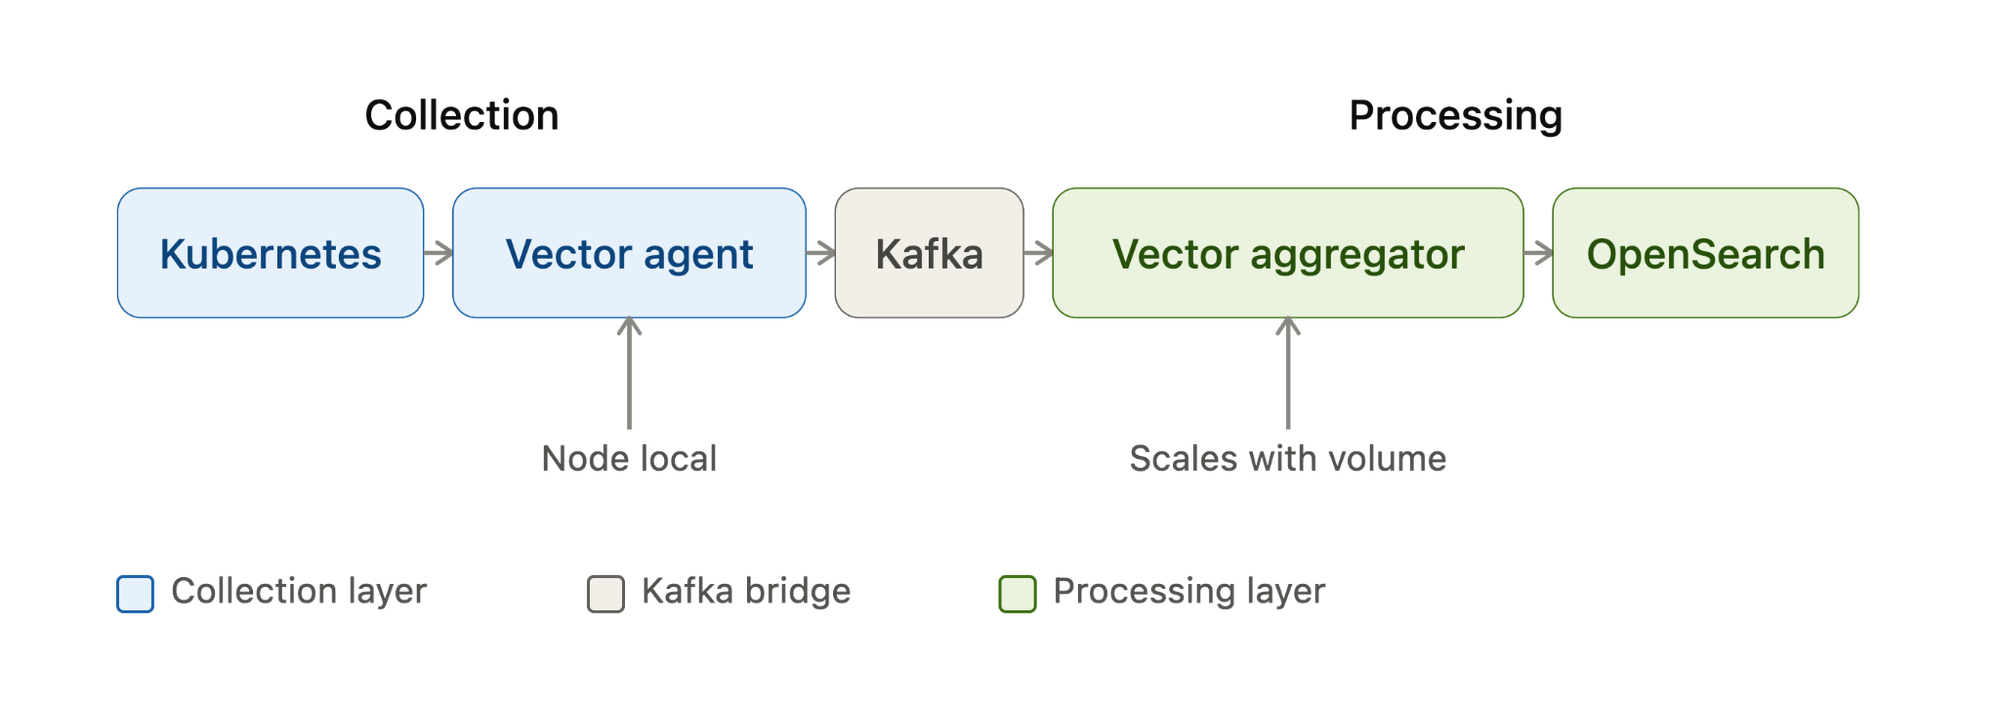
That distinction turned out to be one of the more valuable properties of the whole architecture, and it directly shapes how we think about scaling the platform as a whole.
Horizontal Scaling: Matching Capacity to Demand at Each Stage
Because each layer has a distinct scaling trigger, we never need to scale the entire pipeline just to relieve pressure in one part of it.
Agents scale automatically as nodes join the cluster, since the DaemonSet model means new nodes simply pick up a copy of the agent without any manual step. Kafka scales through additional broker capacity and thoughtful topic partitioning, which lets ingestion grow independently of what OpenSearch can handle. Aggregators scale horizontally whenever consumer lag starts climbing.
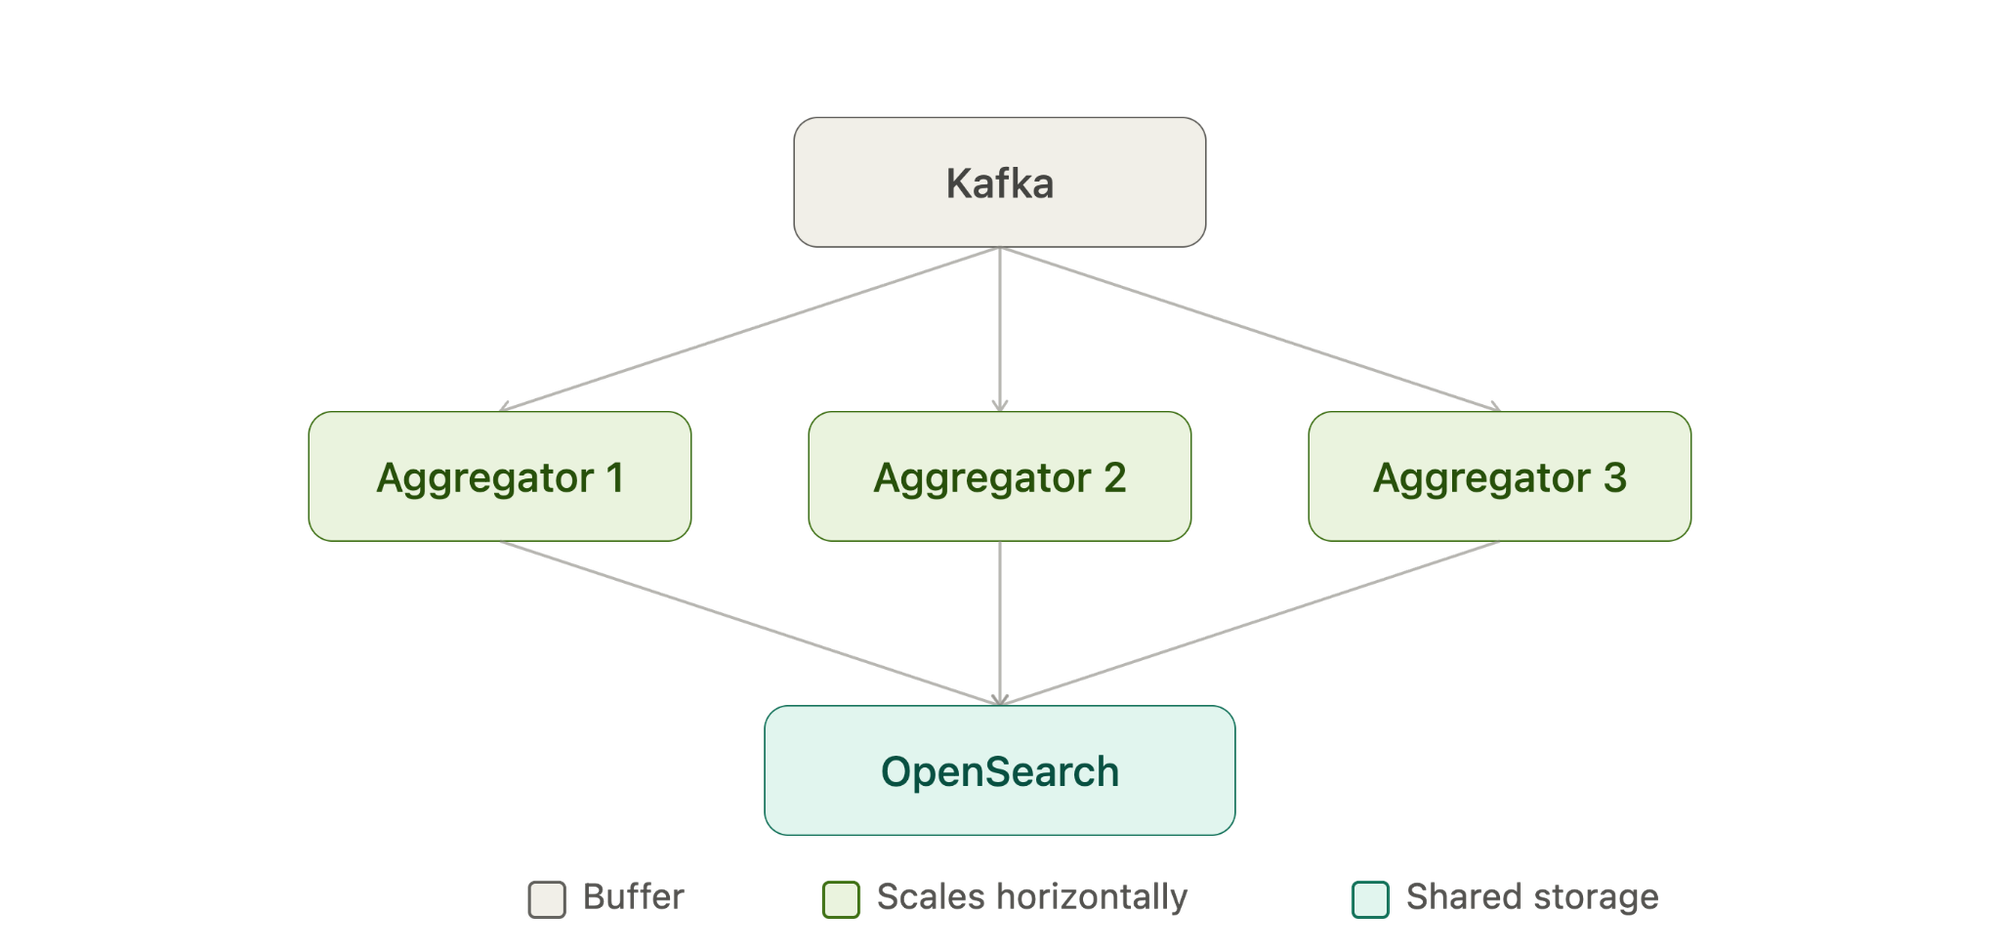
And OpenSearch itself scales as the storage and search layer, helped considerably by the fact that the aggregator writes in bulk rather than sending one request per log line, which cuts down request overhead dramatically. Storage capacity is only half the story though. How we organize what gets stored mattered just as much, which is why we settled on a daily indexing pattern.
Organizing Storage by Day
Logs land in indexes named by date, something like application logs 2026.08.25, application logs 2026.08.26, and so on. It is a small decision that pays off constantly. Retention becomes trivial because old indexes can be dropped or archived on their own schedule. Troubleshooting narrows quickly because you already know which day's index to look at. And nothing grows into one enormous, unmanageable index that slows everything down as it ages.
This daily pattern is really just one expression of a broader habit we tried to apply everywhere in the platform: keep isolation consistent from source all the way through to storage.
Isolation From End to End
The same separation we built into Kafka topics extends further, all the way to individual OpenSearch indexes. Conceptually, each pipeline follows its own path from source to topic to consumer group to index, while still running on shared underlying infrastructure.
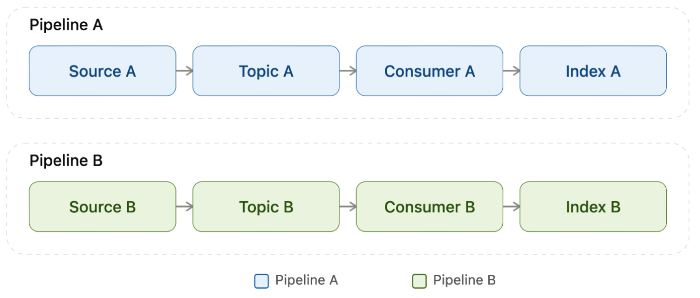
Because this pattern is consistent, adding a new logging use case does not mean building a new platform. It means adding a new instance of a pattern we already understand, which is a much smaller and much safer piece of work. But none of that isolation matters if the configuration behind it is fragile or hard to reason about, which is the problem we turned to next.
Treating Configuration Like Any Other Code
The runtime architecture only solves half the problem. The harder, more persistent question is how you keep the configuration sane as the platform grows to support more teams and more pipelines. Our answer was to treat logging configuration as code, stored and reviewed in version control rather than edited by hand against a live cluster.
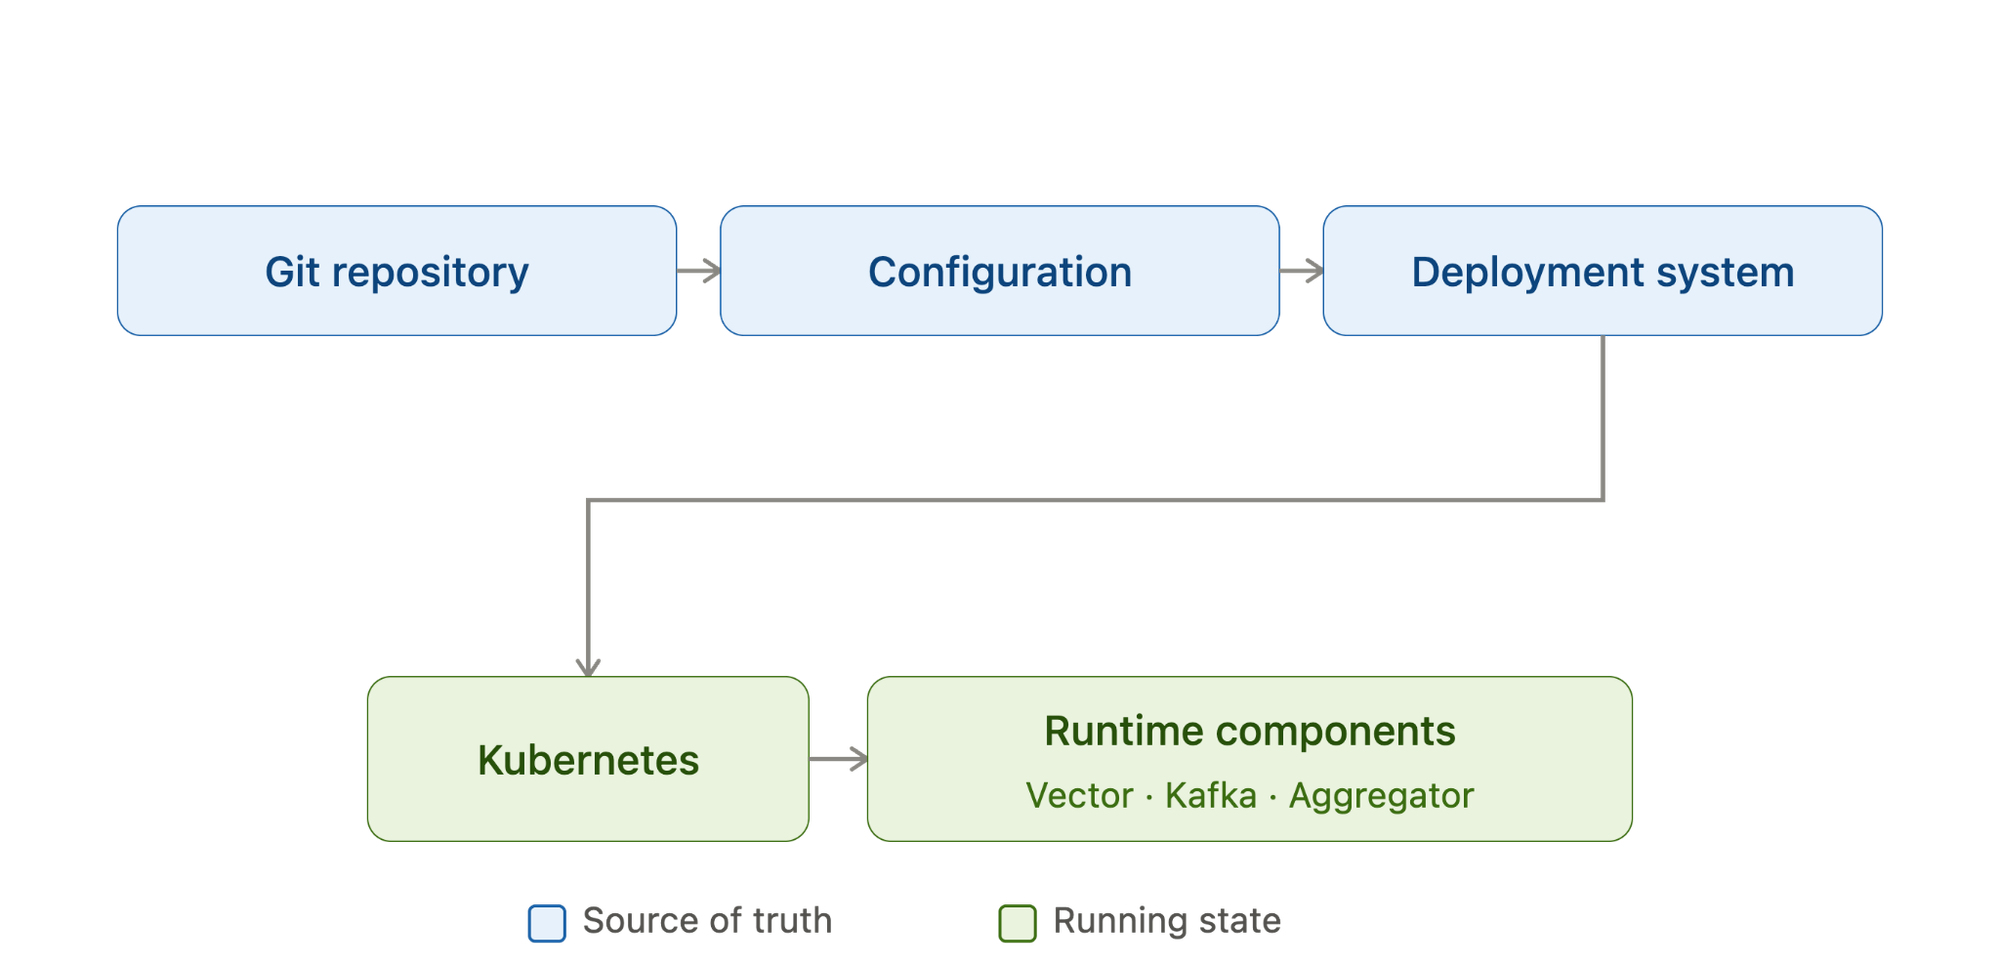
That gives us review before changes land, a full history of what changed and why, straightforward rollbacks, and clean separation between environments. As the number of pipelines climbed, this stopped being a nice to have and became the thing that kept the platform from sliding into drift and chaos, which pushed us to formalize the actual deployment process too.
Making Changes Predictable
Every configuration change follows the same lifecycle: a developer makes the change, opens a pull request, the change goes through review and automated validation, and then it deploys through our GitOps tooling into the cluster.
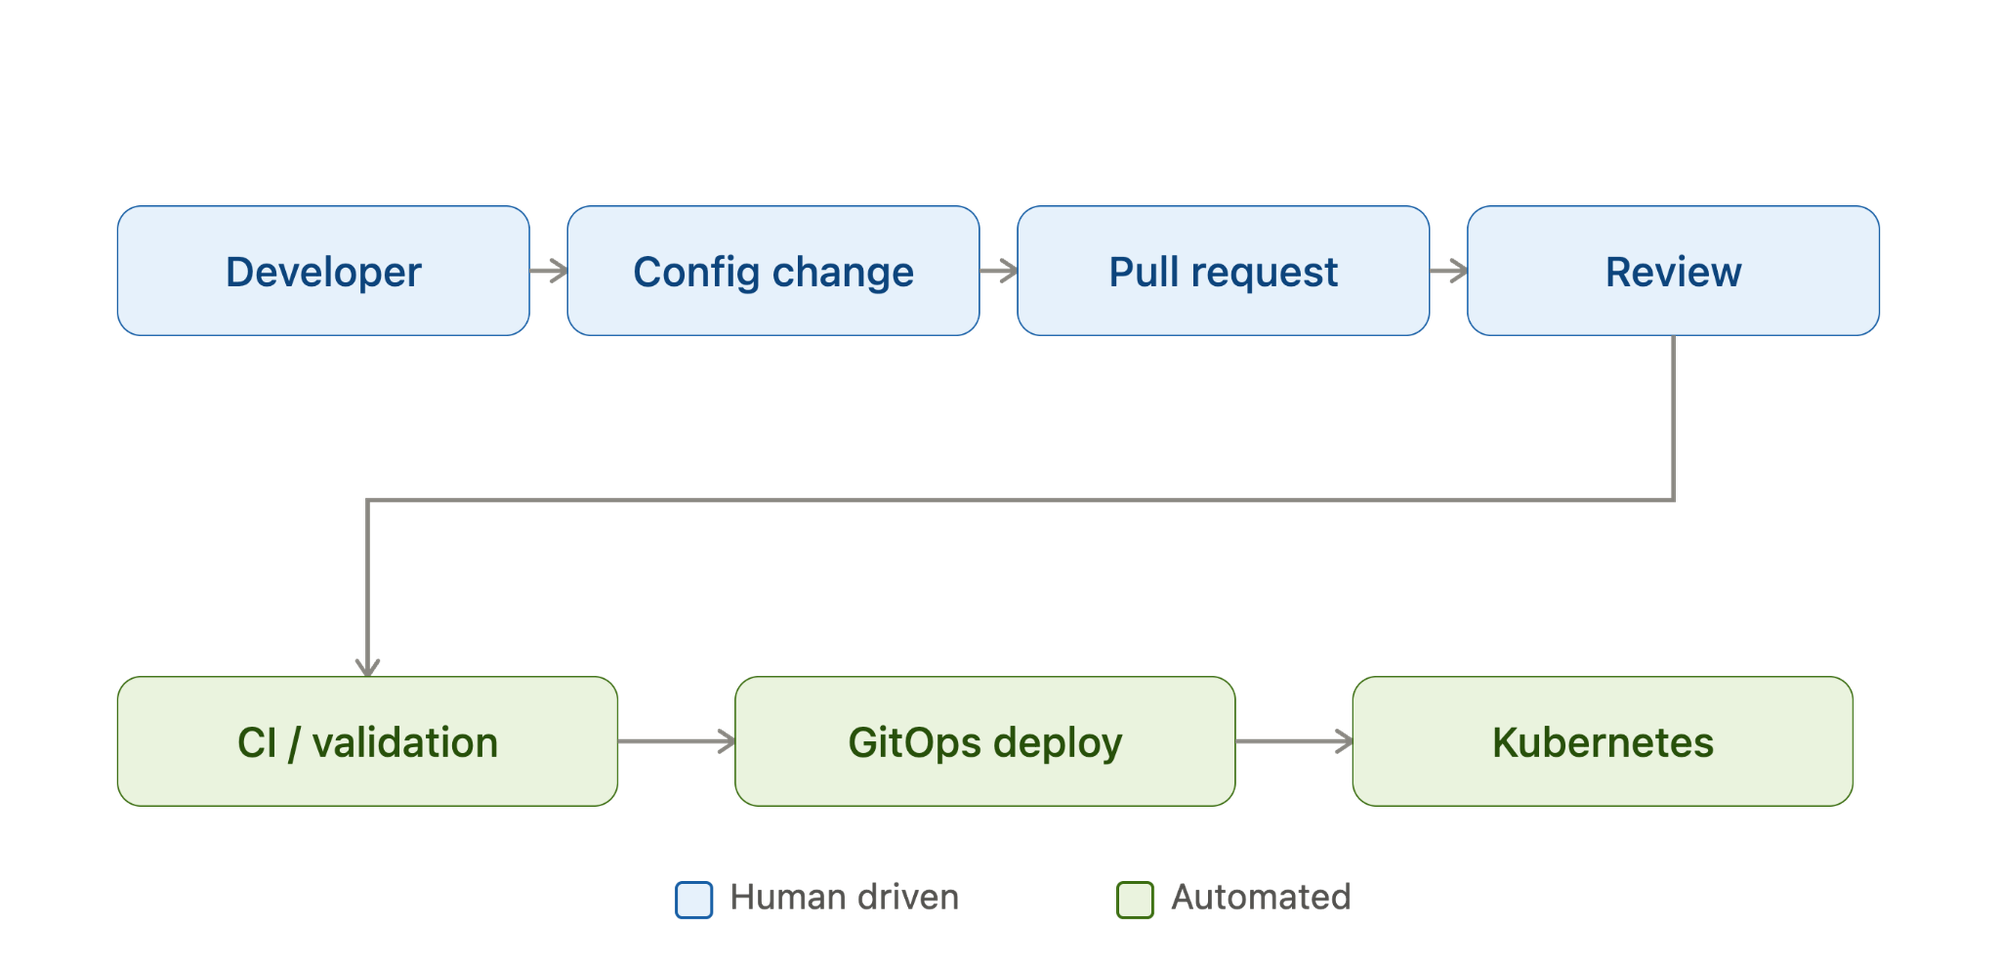
One lesson we learned the hard way is to never treat the live cluster as a source of truth. A quick manual fix might solve today's problem, but the next reconciliation cycle can quietly erase it, leaving you back where you started with no record of what happened. The repository holds the truth; the cluster only ever reflects the desired state we described there. With that discipline in place, we could finally answer the question that really tests whether an architecture is any good: how much work does it take to add something new.
Adding a New Pipeline Without Rebuilding Anything
Bringing a new logging use case online now follows a short, repeatable sequence: define which workloads it applies to, add an agent pipeline for it, create a Kafka topic, wire up an aggregator consumer, define an OpenSearch index pattern, and deploy it through the same workflow everyone else uses.
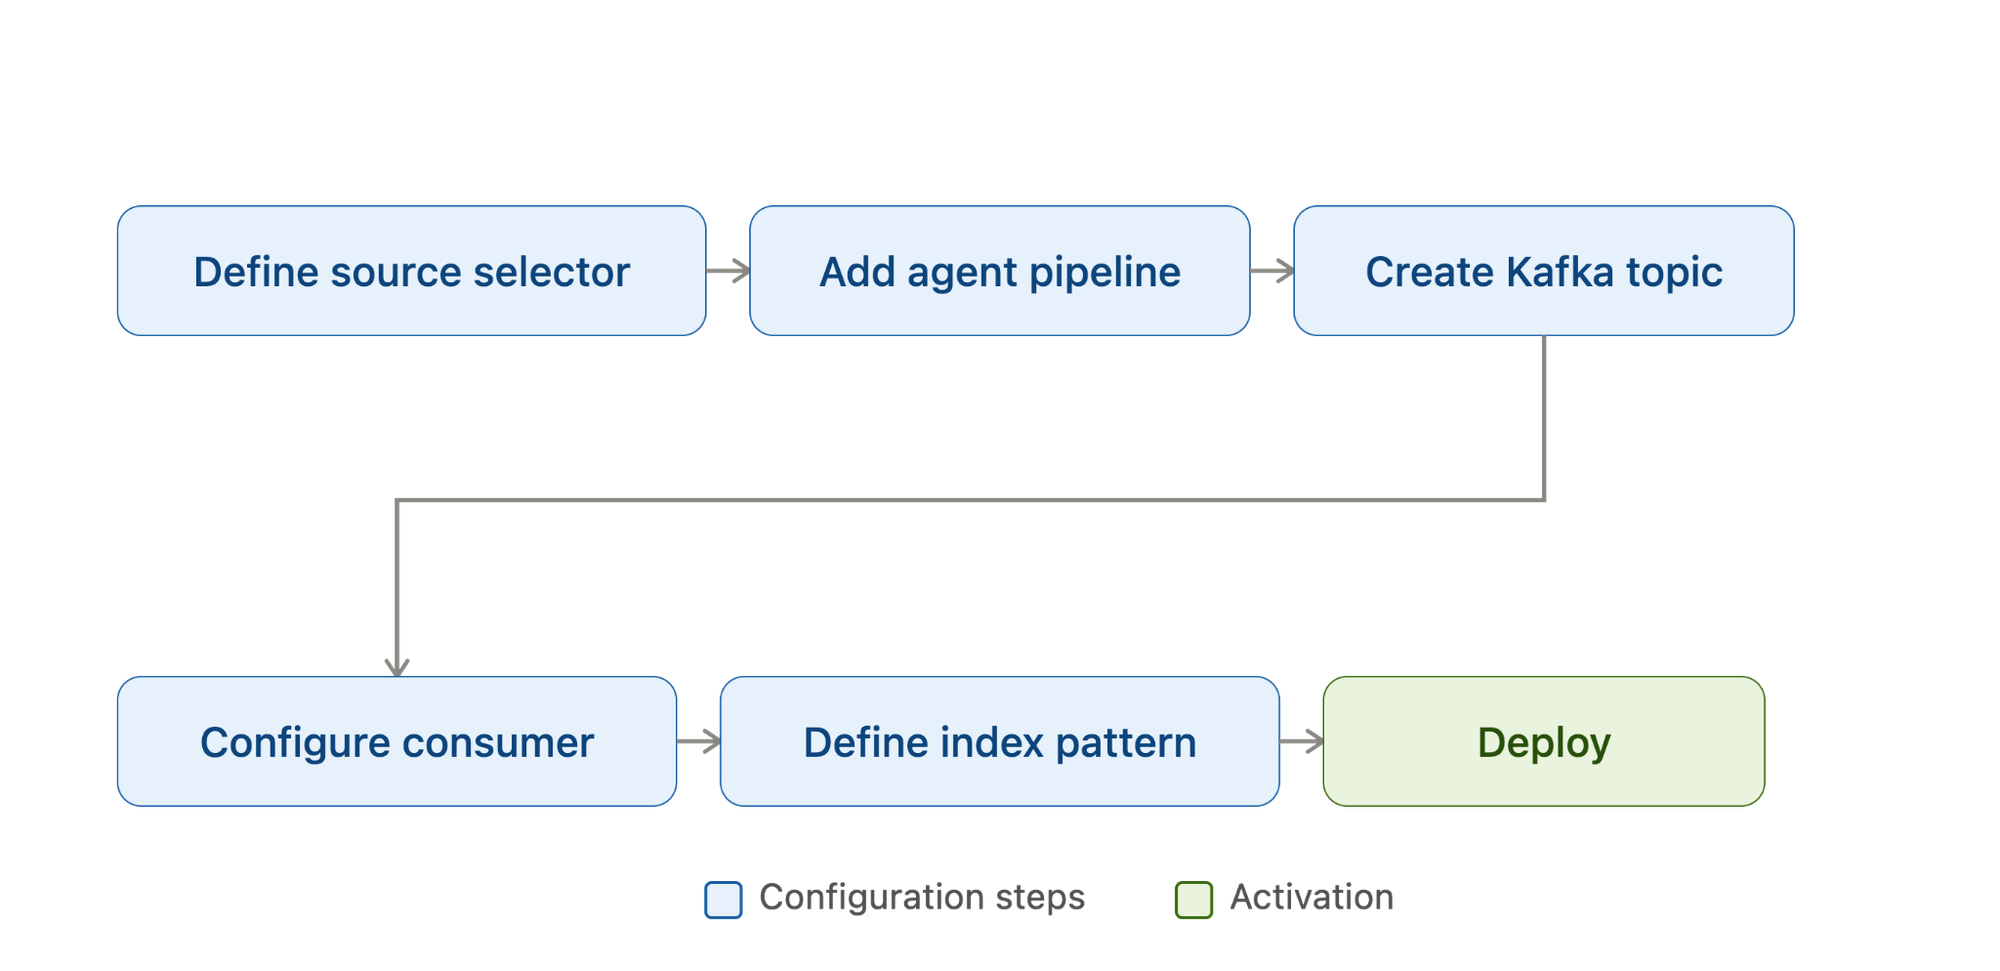
Nothing about the underlying Kafka cluster, the Vector runtime, or the OpenSearch cluster needs to change. Adding a consumer of the platform is a configuration exercise, not an architectural one, which is exactly what you want a mature platform to feel like. Of course, none of this is worth much if we cannot tell whether the platform itself is healthy, which brings up observability.
Operational Observability
A logging system that cannot report on its own health puts you in an uncomfortable position. When application logs go missing, you need to know quickly whether the fault sits with the application, or somewhere further down the chain in Vector, Kafka, the aggregator, or OpenSearch.
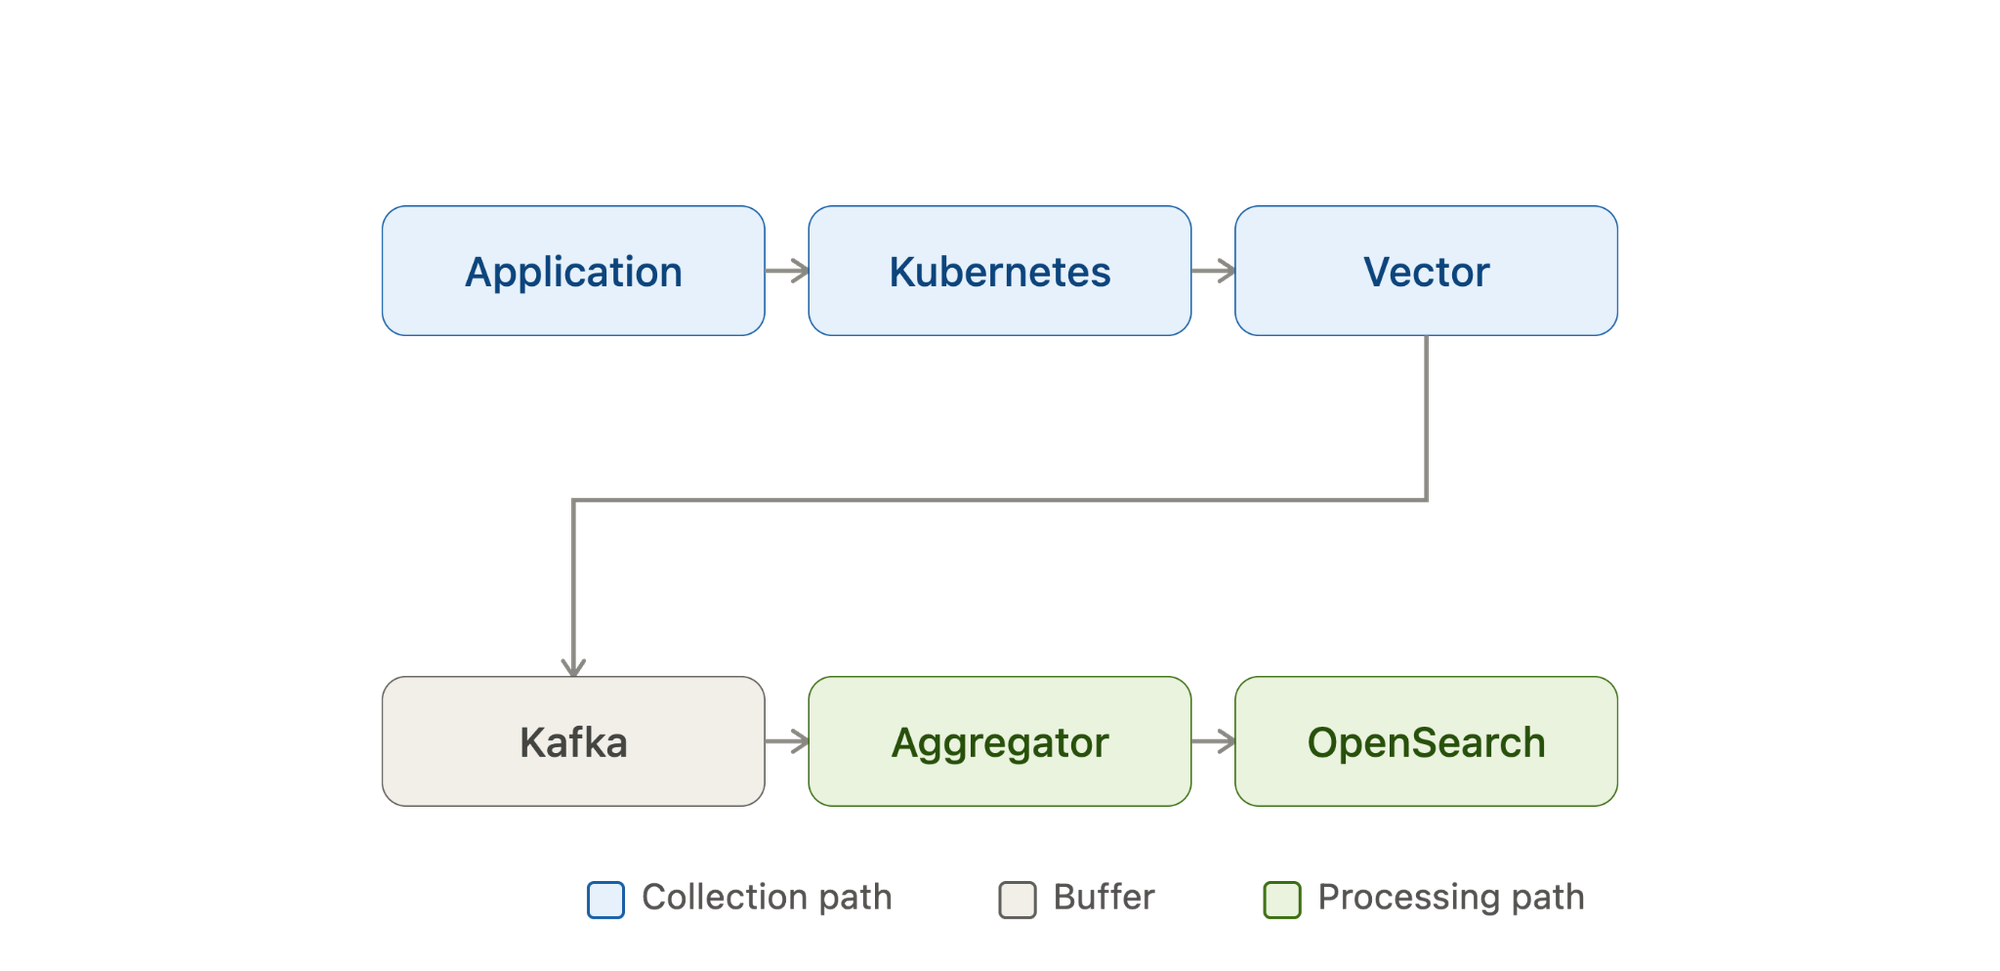
We expose signals at every one of those stages: Vector's internal metrics, Kafka consumer lag and broker health, aggregator throughput, and OpenSearch indexing errors and cluster status. With that visibility, we can separate "the application stopped producing logs" from "the platform stopped processing them," and that distinction alone has saved us countless hours during incidents. Looking back across everything we built, a handful of broader lessons stand out clearly.
What This Project Taught Us
A few principles kept surfacing no matter which part of the system we were working on.
Decoupling ingestion from storage turned out to be the single highest leverage decision in the whole design. Kafka gave us a real boundary, not just a buffer, between collection and the search backend. Keeping the edge lightweight mattered just as much, because anything wasteful running on every node adds up fast across a large fleet, while centralized processing in the aggregator gave us a much cheaper place to do the expensive work. Independent scaling meant we never had to over provision the whole pipeline just because one stage was under strain. Isolating data through topics, consumer groups, and indexes gave us most of the benefit of separate infrastructure without the cost of actually building it. And treating configuration, deployment, validation, and rollback as first class parts of the platform, not afterthoughts, is what has kept the system predictable as it has grown.
Underneath all of that sits one habit worth calling out on its own: designing for failure from the start. The useful question was never "what happens when everything works." It was always "what happens when OpenSearch disappears for half an hour," or "what happens when volume jumps by ten times overnight." Decoupling and buffering are what make those situations survivable instead of catastrophic.
The Resulting Architecture
Put together, the pieces form something closer to a genuine platform than a pile of one off logging configurations stitched together over time.
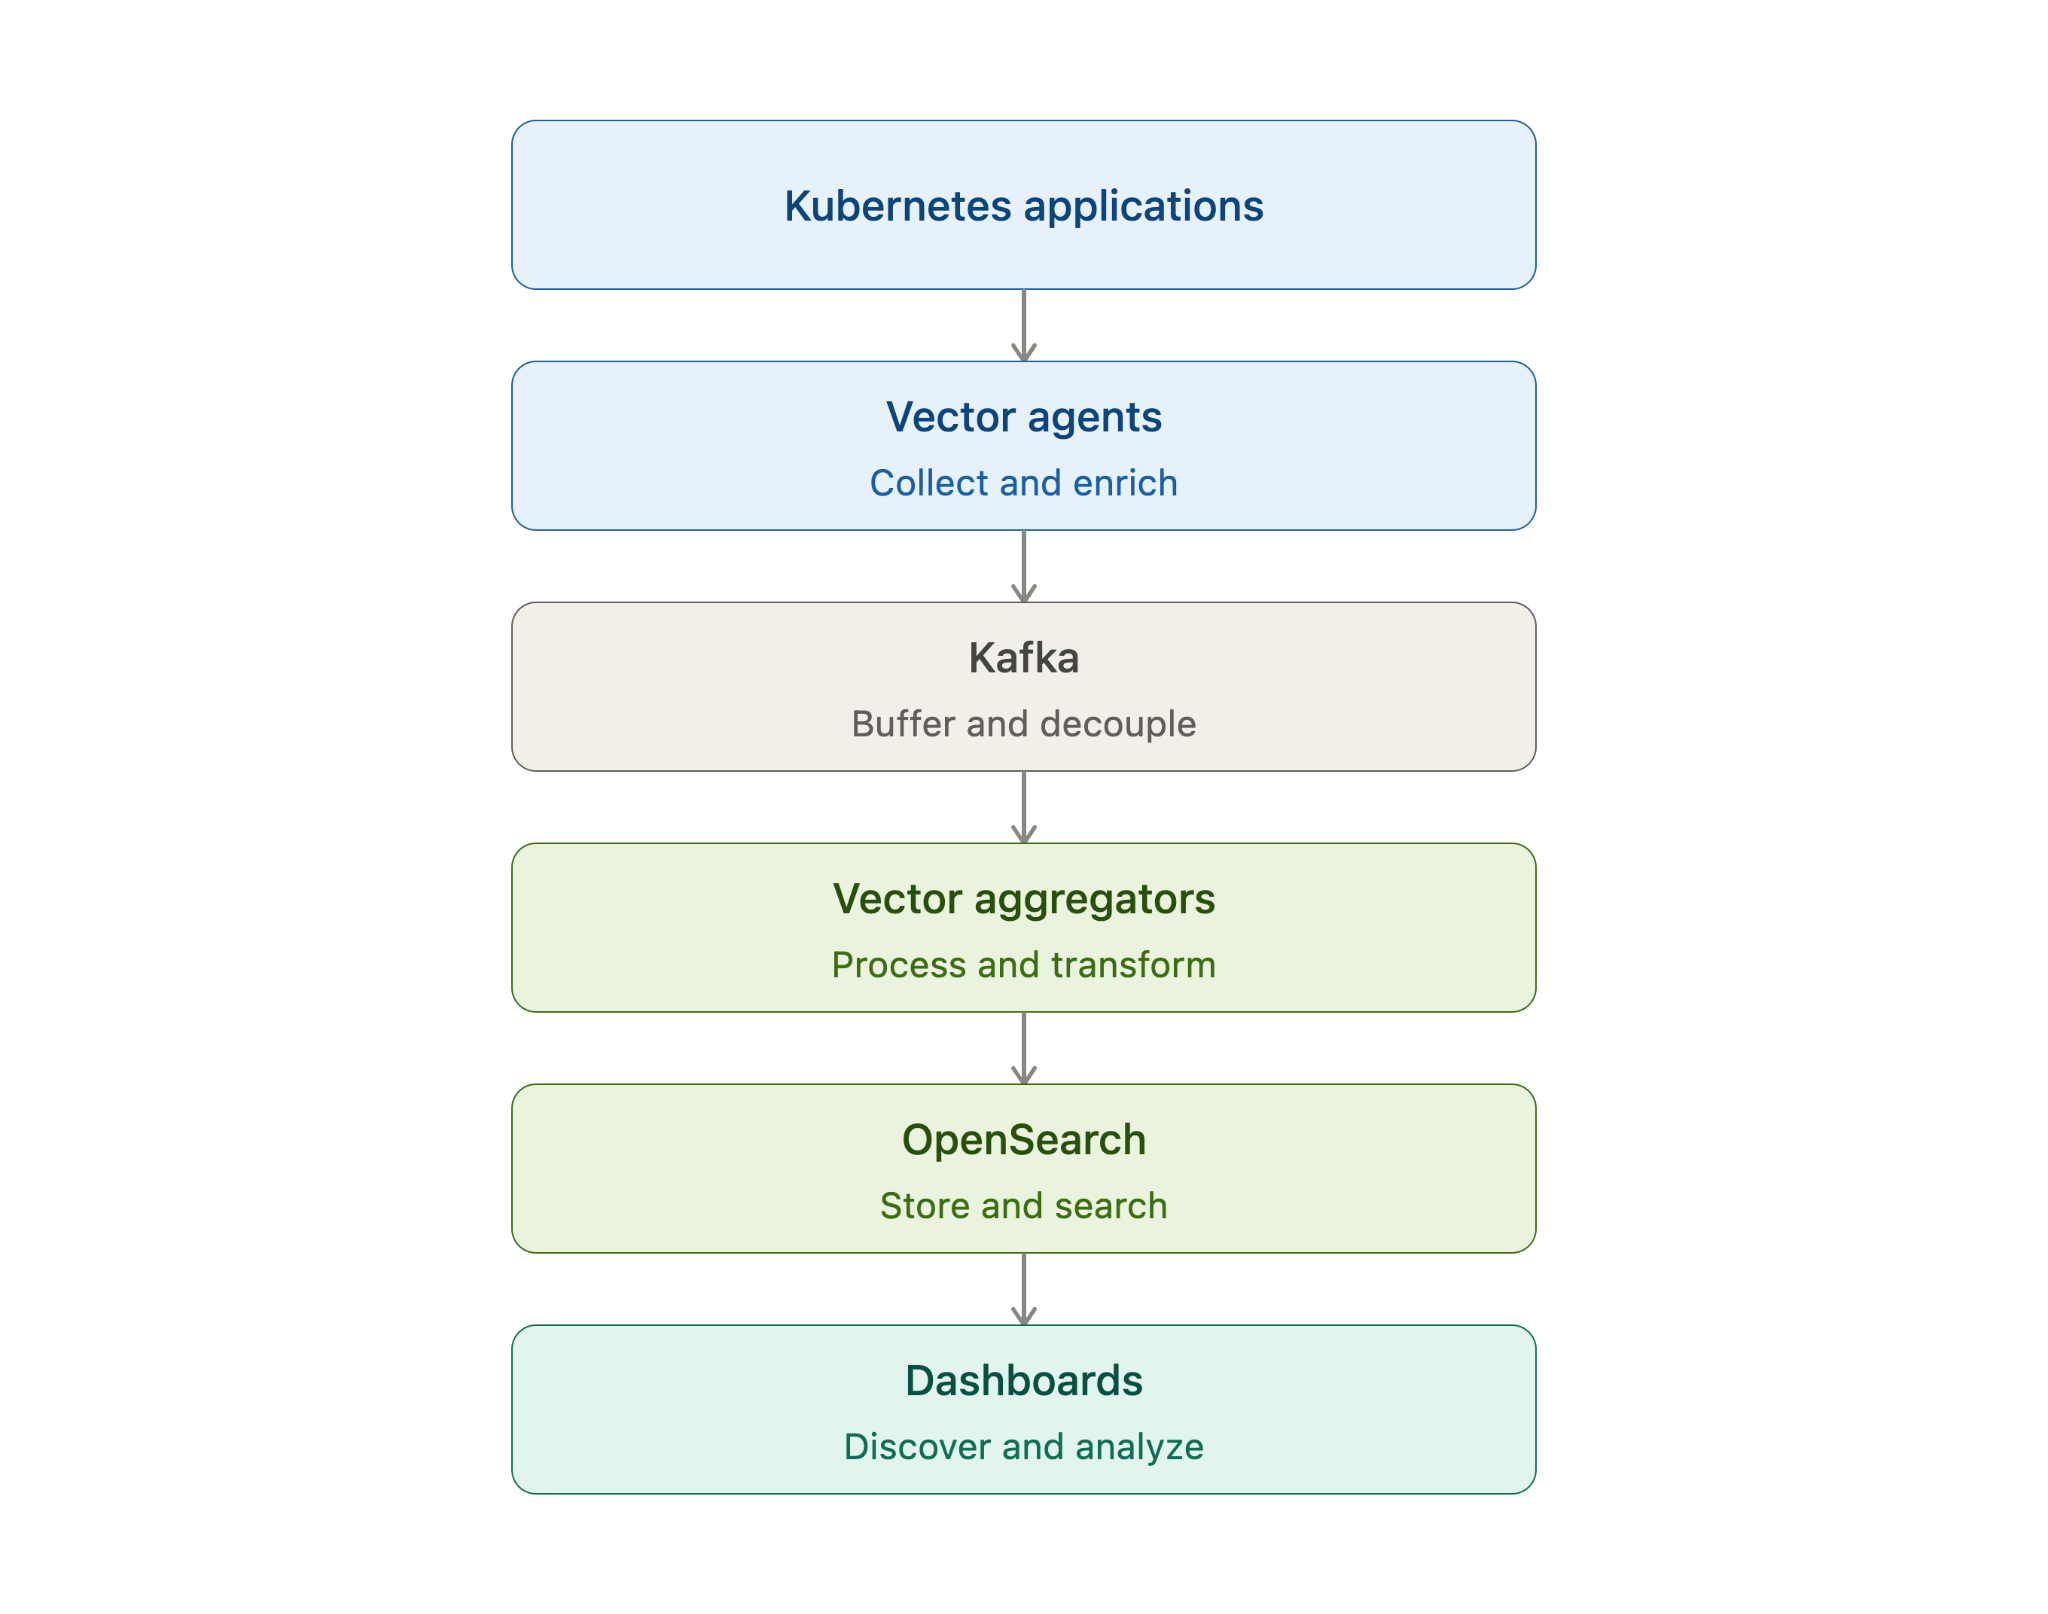
The idea underneath all of it is not complicated: collect close to the source, buffer between systems that move at different speeds, process centrally where it is cheaper to do so, and store in a backend built for search. That separation is what lets the platform grow alongside the Kubernetes environment it serves, while keeping every individual pipeline isolated and manageable on its own terms.
What I care about most, looking back, is not that the system works today. It is that the next requirement, whatever it turns out to be, will most likely arrive as a small configuration change rather than a redesign. That, more than any single technology choice, is what platform engineering is actually supposed to deliver.
For more on the design decisions and hard-won lessons behind our large-scale data infrastructure, check out engineering.acceldata.io, we publish new technical deep dives there regularly.